Cautious positive outlook amid rising volatility
The 20DMA support is at 17162. Below this level, it may test 17032
image for illustrative purpose

The stock market ended the year 2021 on an optimistic note. During this year, The NSE Nifty gained by 24.15 per cent, from 13981 to 17355 points. In the last one month, it advanced by 380.40 points or 2.24 per cent after witnessing higher volatility in recent time. On the last day of the year, the benchmark index gained by 150.1 points and settled at 17354.05. During the last week, the Nifty Midcap-100 and Smallcap-100 are advanced by 2.8 per cent and 4.1 per cent, respectively. Nifty Pharma is the top gainer with 5.4 per cent and the Auto index up by 2.9 per cent. Barring Nifty Media (-1 per cent), all the sectoral indices ended in the green. FIIs sold Rs 35,493.59 crore worth of equities in the last month. The DIIs bought Rs 31,231.05 crore. In 2021, the FIIs sold Rs 91,626 crores.
On a monthly timeframe, it is clearly bullish with all the key Moving Averages are trending upside and widening from one another, indicating good strength in the rally. The momentum indicators, RSI & ADX – DMI, are also quite bullish. However, the +DMI rising, showing the increasing power of bulls, is not able to breach the prior -DMI (red line on the same pane) peak of March 2020. That looks something of a blemish on the otherwise strong rally. Since March 2020, all corrections in the Nifty were confined to just one month with a closing monthly low, including the recent one of Nov 2021.
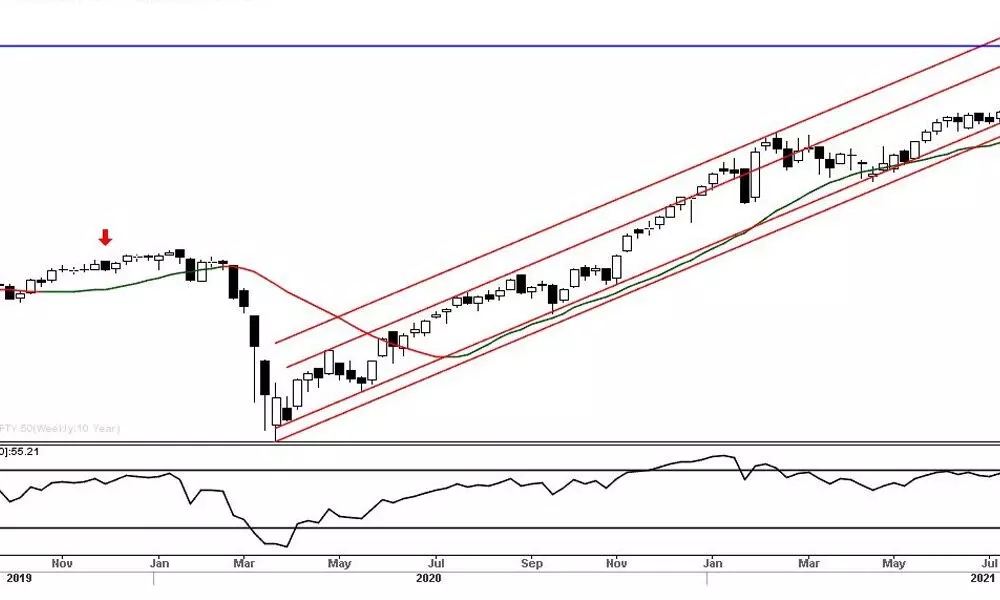
On the weekly time frame, the short-term moving average had a second pinch last week (after the earlier one in May 2021), and the price has bounced from 40-week average support that is sloping up along with the 20-week MA indicating that the rally strength is still good. During late Sept and early October 2021, price and momentum showed a negative divergence indicated on the weekly chart. That negative divergence pushed the index down below its key moving averages of 20, 50, and 100.
A similar structure happened between January and February 2021 that also pushed the index down below the said three key MAs. That -ve divergence was negated when RSI broke above the down-sloping line (marked A & B on RSI) and simultaneously index moved back above the 20 & 10-week moving averages as well as breaking above the price trendline during May 2021. The current negative divergence is still in force and we need to wait till RSI crosses above the C-D trend line, and the price moving above the key moving averages and break above the price trendline that has been acting as resistance since mid-Oct 2021. However, as long as the slope of 20 & 40 moving averages does not tilt down my bias for a continued uptrend on this timeframe is unshaken.
The benchmark index, Nifty, extended its pullback in the expected line on the daily time frame. It retraced over 78.2 per cent of the prior downswing, which is highest compared to the past two swings. The earlier retracements were limited to less than 61.8 per cent of the prior downswings. In the 567 point range, the Nifty was able to garner a net gain of 350 points. The Nifty has formed a long-legged doji candle on a quarterly chart. The 20-week average is placed at 17485, which may act as immediate resistance. And, the 17500-516 zone will also act as a resistance where the sloping trendline and 50 DMAs are present.
The prior swing high is at 17639. As long as these levels are protected, the index continues to be in the downtrend. As per the Dow theory, the trend reversal happens only above the prior swing high. On the downside, a close below the prior day low will first indicate the weakness and the resumption of the downtrend. The 20DMA support is at 17162. Below this level, it may test 17032. In any case, it closes below this level, and the Nifty will test the prior low of 16410 and below. As mentioned earlier, the pattern measured target is 16211.
For the fourth consecutive day, the index sustained above the 20DMA. After two consecutive Doji candles, the Nifty closed above the last three days of the sideways range is a positive for the market. As the global markets are closed, the first trading day in 2022 may start with a subdued note. As the Nifty retraced more than expected, it may consolidate with some volatility. The probability is it may oscillate between 50 and 20DMAs. A cautiously positive outlook is advised for the coming week.
(The author is financial journalist, technical analyst, family fund manager)

