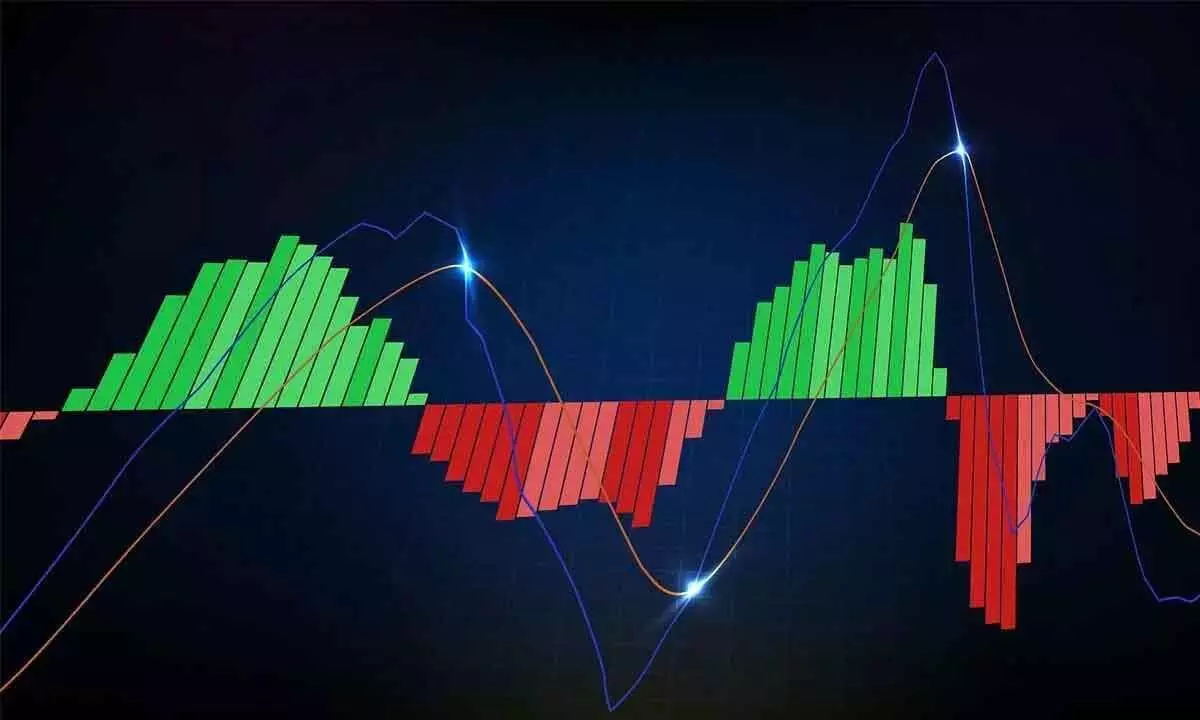
Weekly MACD line flags bearish bias
The weekly RSI is at 66.87 and still holds the bearish divergence, as it has not closed at the new high
image for illustrative purpose

The distinctive pin bar or a Dragonfly Doji candle is a very rare occurrence. This candle pattern at new high indicates the potential reversal
NSE Nifty recovered losses occurred last Tuesday (June 4) and registered the highest closing. In an eventful week, Nifty gained by 759.45 points or 3.37 per cent last week. BSE Sensex also gained by 3.69 per cent. The Midcap-100 and Smallcap-100 advanced by 2.88 per cent and 3.11 per cent, respectively. Only the PSU Bank index was down by 1.41 per cent. The Nifty IT is the top gainer with 8.6 per cent, and FMCG is up by 7.11 per cent. The Nifty Auto index also gained by 6.83 per cent. The Volatility index, India VIX, collapsed by 48.37 per cent from its high of 31.70 to 16.40 during the week. Finally, it settled at 16.47. During the week, the FIIs sold Rs.13,718.42 crore, and the DIIs bought 5,578.71 crore worth of equities.
Nifty made a unique and rare move in the last week, moving in a 2,057 points range and forming a 2,008 points-long lower shadow. This distinctive pin bar or a Dragonfly Doji candle is a very rare occurrence. This candle pattern at new high indicates the potential reversal. The index also saw a significant surge in volume, a level not seen since the 3rd week of February 2021. In just five trading sessions, the index encapsulated the last six months of price action. Following this significant move, the Nifty marked its highest closing in its history. In this eventful week, several supports were breached, and resistances were cleared, adding to the intrigue of the market’s performance.
However, if we ignore June 3-4 price action, there is nothing wrong with the overall trend. In fact, the Nifty has decisively broken out of a rising channel with a higher volume. It is trading above all key moving averages. The 10-week average acted as support last week. On Tuesday, the index closed below this key average line. Now, it is trading 3.61 per cent above the 50DMA.
As the euphoria cools off, the index may move slowly on the upside. It retests the breakout level. If it closes within the channel, we will see a retest of the 50DMA of 22,477. Before this, the 23.6 retracement level of the last three-day recovery is at 22,839, which is immediate support. The profit-taking-led retracements after the massive price move normally test the 38.6 level, which is currently at 22,541 points.
The weekly RSI is at 66.87 and still holds the bearish divergence, as it has not closed at the new high. The weekly MACD line is below the signal line and stays with a bearish bias. The leading indicators continue to show bearish divergences as a caution. At the same time, the breadth is not strong enough at the higher levels. These are the indications of market is potential for a profit booking retracements.
The Nifty Pharma index has broken out of a flat base. The Nifty IT index tested the prior Stage-1 base breakout level and closed above the 50 per cent retracement level of the prior fall. The Auto index closed at a new high, and the FMCG is at a prior pivot. Next week onwards, the sector stocks will be in the limelight. Select the stocks in these sectors that have higher relative strength.
(The author is Chief Mentor, Indus School of Technical Analysis, Financial Journalist, Technical Analyst, Trainer and Family Fund Manager)

