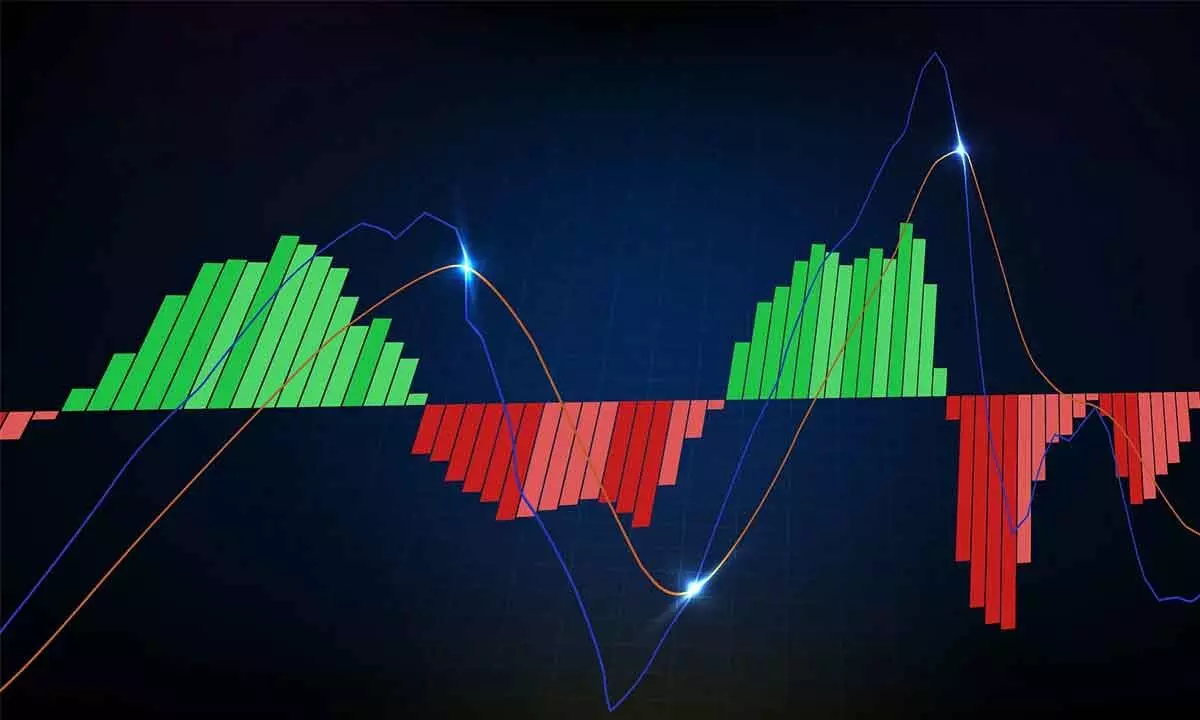
Weekly MACD flags rising bearish bias
The daily price pattern is like a Double-Top, the two tops formed bearish candles, like a Shooting Star and a Gravestone Doji; All indicators showing downtrend
image for illustrative purpose

The market is very volatile and will continue to be volatile for the next four weeks. It is better to avoid derivatives and stick to highly conviction stocks in the portfolio. Try to book some profits and stay on the sidelines with more cash
The equity frontline indices registered the worst fall after the second week of March. The Nifty declined by 420.65 points or 1.87 per cent. The BSE Sensex fell by 1.64 per cent. The broader market indices, Nifty Midcap-100 and Smallcap-100, are down by 2.75 per cent and 4.90 per cent, respectively. On the sectoral front, the FMCG up by 1.85 per cent, is the top gainer. The Auto and IT indices were gained by 1.36 per cent and 0.08 per cent. On the flipside, the PSU Bank index is down by 6.03 per cent, followed by Media by 4.25 per cent. The FIIs sold aggressively Rs21,619.05 crore last week. As of date, they sold Rs24,975.50 crore worth of equities in this month. Whereas the DIIs bought Rs19,410 crore. The advance-decline ratio is mostly negative during the week. The India VIX is up by 26.37 per cent to 18.47.
The stock market is nervous on the eve of general elections. With increased volatility, the Nifty declined below the 20-week average after a major low in October 2023. As the index decisively closed below the 10-week average and the 50DMA, the market status changed to the ‘Uptrend Under Pressure.’ If the index closes below the 21,860-21,710 zone of support, it will enter into a confirmed downtrend. Currently, the index is 1.09 per cent below the 50DMA. It took support on 100DMA on a closing basis. The 100EMA is at 21,821 points. A series of supports are placed in the 21,860-21,710 zone. Once this support breaks, we will see a panic selling pressure in the market.
The daily price pattern is like a double-top. The valley point is at 21,777 points. In any case, a double-top pattern breakdown on a weekly basis with added distribution days will be strongly negative for the short term. The 38.2 per cent retracement of the current uptrend is at 21,283 points. In the most bearish case scenario, the Nifty can test this if the crucial support zone breaks down with a higher volume. For the last seven weeks, the volumes were below the average. Interestingly, the two tops formed bearish candles, like a Shooting Star and a Gravestone Doji.
The weekly RSI (57.19) formed a new low, below the prior low, and got the confirmation for its bearish divergence. After the November 2023, the RSI entered into the neutral zone. The weekly MACD shows a strengthened bearish momentum, and the daily MACD line is already below the zero line. Increasing histograms on weekly and daily charts show that the momentum is on the downside.
The India VIX, volatility indicator or fear index, rose by 94.50 per cent from the 23rd April’s low of 9.85 to 18.47. This spike in the market indicates more volatility due to event risk. On a closing basis, it is the highest level after 13th October. At the same time, it has been losing relative strength since April 2023 compared to the broader market. This underperformance is also a reason to be cautious.
Currently, the Nifty closed on the rising channel’s support line, which is also within the support zone of 21860-710. Typically, the market will discount the probable event risk much earlier. Expect the fall to halt in another two weeks and may form a base or some short-term pattern. A breakout or breakdown will happen on the outcome.
There is not much change in the Relative Rotation Graphs. The Metal index looks strong in the leading quadrant as it has better relative strength and momentum. The Auto Index is losing its momentum and may underperform. The Consumer Durable Index is about to enter into the leading quadrant. The Bankifty, FinNifty, and FMCG are in the improving quadrant and may outperform in the next week. All the sector indices were losing momentum and relative strength.
For now, the market is very volatile and will continue to be volatile for the next four weeks. It is better to avoid derivatives and stick to highly conviction stocks in the portfolio. Try to book some profits and stay on the sidelines with more cash.
(The author is Chief Mentor, Indus School of Technical Analysis, Financial Journalist, Technical Analyst, Trainer and Family Fund Manager)

