Technicals Show Increased Bearish Momentum
Stay away from leveraged positions; On a weekly chart, the index has formed a Doji candle with a long upper shadow, indicating the bearishness
Technicals Show Increased Bearish Momentum

Barring the Metal index, all the sectoral indices declined, and the broader market also weakened. The index must close above 22921 for a short-term positive bias. The 23046 will be the crucial resistance, on the downside, it can test 22350
The equities were nervous on the weekend. The benchmark index closed at its lowest level. The Nifty declined by 117.25 points or 0.51 per cent and closed at 22795.90. Only Metal index closed positive by 1.02 per cent. All other indices closed lower. The Auto is the top loser with 2.58 per cent. The Healthcare and Pharma indices are down by 1.92 per cent, each. The PSU Bank, Midcap, Realty, Media, Consumer Durable, Oil and Gas, and Banknifty declined by over one per cent. The India VIX has also declined by 1.04 per cent. The market breadth is negative as 1744 declined and 1100 advanced. About 91 stocks hit a new 52-week low, and 170 stocks traded in the upper circuit. Godrej Industry, M&M, BSE, HDFC Bank and JSW Energy were the top trading counters in terms of value.
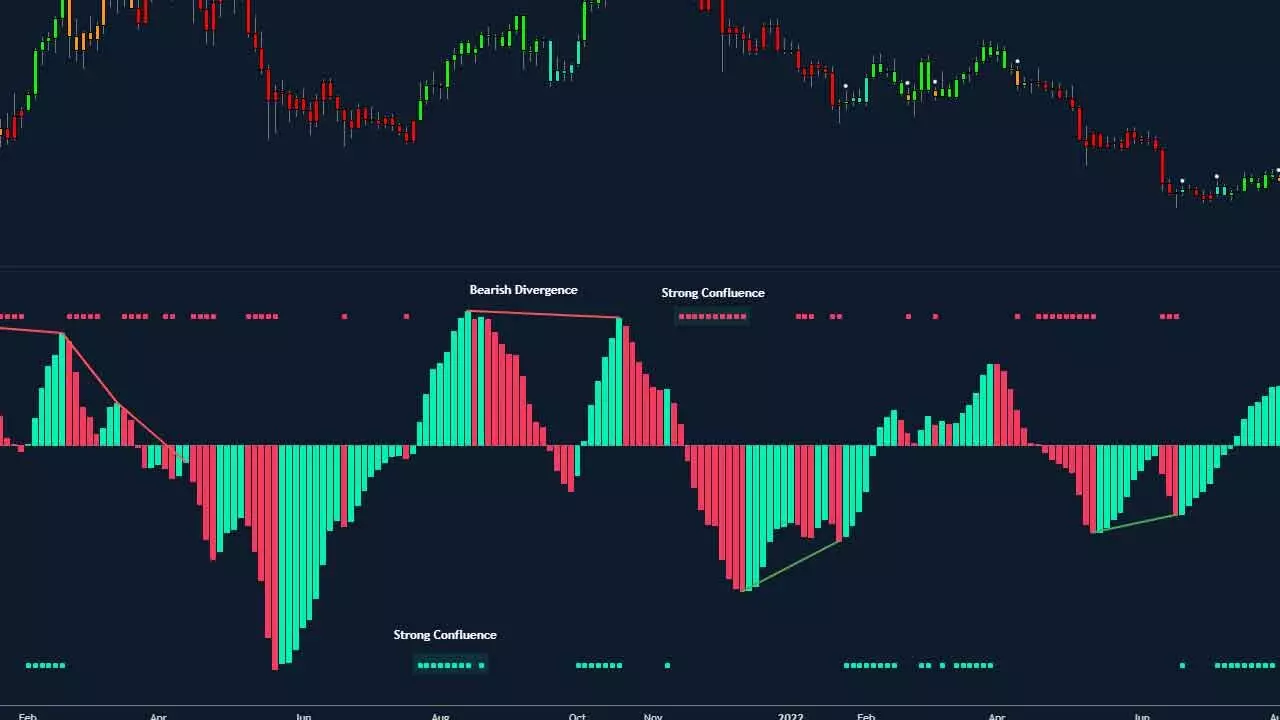
The Nifty registered the lowest closing after 27th January. It also closed the lower range of the last seven days’ consolidation. The index closed below the psychological support level of 22800. The current price pattern looks like a descending triangle on a lower time frame and a pennant on a daily time frame. On a 0.51 per cent decline day, the volumes were higher than the previous day and registered a distribution day. Barring the Metal index, all the sectoral indices declined, and the broader market also weakened. The index made a new low at 22720.30 on Friday. Now, the index is 5.28 per cent below the 200DMA and 2.74 per cent below the 50DMA. The RSI declined to 34.93, and it is near to the oversold condition. The MACD shows an increased bearish momentum. On a weekly chart, the index has formed a Doji candle with a long upper shadow, indicating the bearishness. It also closed at near the previous week’s low. For now, the index must close above 22921 for a short-term positive bias. The 23046 will be the crucial resistance. On the downside, the index can test 22350 if it fails to move higher. Stay away from leveraged positions.
(The author is partner, Wealocity Analytics, Sebi-registered research analyst, chief mentor, Indus School of Technical Analysis, financial journalist, technical analyst and trainer)

