Wait for a decisive reversal signal
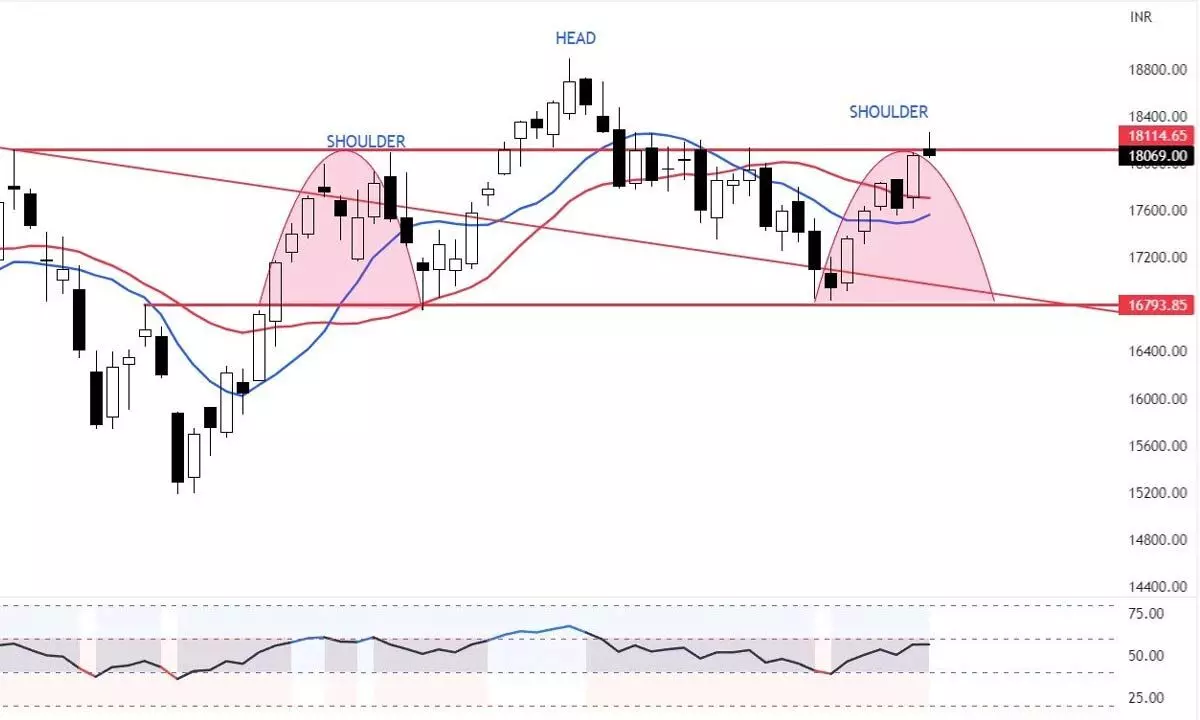
Now, the question is, will the Head and Shoulder pattern break below the neckline? The neckline is placed at 16,800 level; After an 8% rally in the last 6 weeks, the weekly 14-period RSI is still in the neutral zone
image for illustrative purpose

The weakness in global markets and MSCI changed the HDFC merged entity weightage in the index have pulled the benchmark indices. NSE Nifty declined by only four points during the week. BSE Sensex declined by 0.10 per cent. The Midcap-100 and Smallcap-100 outperformed by 1.11 per cent and 0.59 per cent, respectively. The Nifty Auto is the top gainer of the week with 1.11 per cent. Bank Nifty and FinNifty declined by 132 per cent and 0.71 per cent, respectively. The Advance-Decline Ratio was mostly positive except on Friday. The volatility index, India VIX, is up by 12.87 per cent and closed at 12.29. FIIs bought Rs5,527.76 crore and the DIIs sold Rs2,735.25 crore worth of equities.
The Nifty formed a Shooting Star candle on the weekly chart. During March last week, the right shoulder high was formed with a Shooting Star. It formed with a small whipsaw. The symmetry is not disturbed as it formed a bearish candle with a distribution day. There are multiple resistances around the 18,114-18,265 zone. It’s exactly reacting from the resistance zone. After an eight per cent rally in the last six weeks, the weekly 14-period RSI is still in the neutral zone. Thursday's strong bullish candle and a breakout above the prior pivot, now doesn’t have any relevance. The daily and weekly candles are in a similar structure.
Now, the question is, will the Head and Shoulder pattern break below the neckline? The neckline is placed at the 16,800 zone. As mentioned earlier, it may take 3-4 weeks to reach the neckline in normal price action. As we projected, the right shoulder top was formed in exactly six weeks. Importantly, the Nifty has reacted from the trend line resistance drawn from March 2020 low. This is another reason to project the right shoulder top. The decline from here is very impulsive in nature. Before reaching the neckline, it may take supports at 17925, 17717 and 17548. Only below 17373, which is a 61.8 per cent retracement of the current upswing, will get the confirmation for a bearish reversal. The 10 and 20-week averages are also 50 and 61.8 per cent retracement levels. We may see a bounce from these levels. In any case, if the bears fail to drag the market down, moving above 18,268 will negate all the bearish views.
Last week, we hinted at the low VIX scenarios. As expected sudden and a sharp sell-off came at the weekend. Even after a 13 per cent rise in VIX, it is still below the normal range and at near historical lows. Any further spike in VIX will result in sharp falls. Any indicator will not sustain a longer period in an oversold or overbought zone. As we expect, if the VIX rises beyond the 15-17 zone, the 17378 will be tested in no time. We have experienced all the breakouts in major stocks were failed and triggered the stop losses on Friday. Unless they go beyond the previous week’s high, we cannot stay on the long side.
In the most bull case scenario, the Nifty has sustained above the 18240-268 zone. The inverted Head and Shoulders pattern on a daily chart has met the right shoulder target. If the Nifty retests the neckline again means testing the 17,863 points. A bounce from here must be with the support of higher volume and move above the resistance zone of 18,240-18,268 points.
On the front of the indicator, even after the eight per cent rally, the weekly 14 per daily RSI is still in the bullish zone. But it declined from 74 to 63 in just one day. All the major momentum indicators are reacting from the extreme zone. Even the Elder impulse system has formed a neutral bar. No sector is in a position to lead the market. Only two sectors, FMCG and FinNifty, are in the leading quadrant, but losing momentum. There is some momentum built up seen in Pharma and Energy sectors. The Realty and Consumer durable sectors are also in the improving quadrant and need to maintain their momentum and relative strength.
The earnings season was not robust to date. As major companies already declared their earnings, do not expect the fundamentals will support the market. For now, it is time to protect the profits and wait for a decisive reversal signal or continuation confirmations.
(The author is Chief Mentor, Indus School of Technical Analysis, Financial Journalist, Technical Analyst, Trainer and Family Fund Manager)

