Technical charts indicate limited room for upside
16448-757 will act as crucial for future trends; Indicators confirm markets entry into bear market
image for illustrative purpose

The domestic equity markets swapped four weeks decline and closed positively. On Monday, the week started on a weak note with a huge gap down opening and made a new swing low. The benchmark indices recovered from the low and closed higher. After oscillating in the 1085.85 points range, it finally settled with a net gain of 385 points or 2.37 per cent. The BSE Sensex is also up by 2.4 per cent. The broader market indices, Midcap-100 and Smallcap-100 indices outperformed by 2.5 per cent and 4.2 per cent, respectively. The Media index gained by 6.7 per cent and the Pharma index up advanced by 6.34 per cent were the top gainers. FIIs continued to sell equities aggressively. In the last seven trading sessions, they sold Rs43,303.05 per cent. DIIs bought Rs30,329.05 crore. The Market breadth is mostly positive during the week.
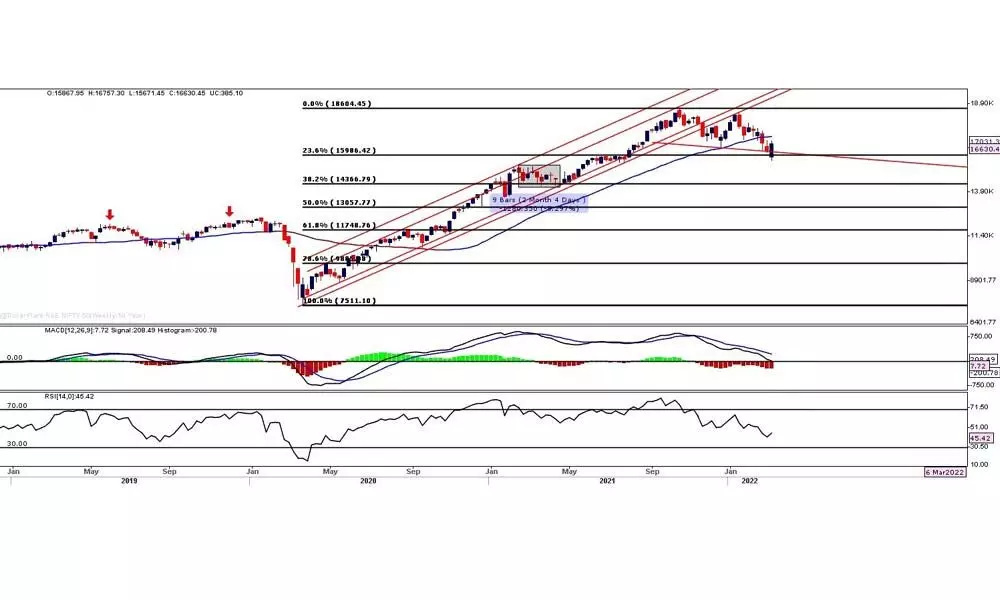
The benchmark index, Nifty, has formed a bullish Engulfing candle on a weekly chart. Technically, the index has formed a short-term bottom at 15671. The four days of price action on the upside with positive gaps is an indication of a rally attempt. Next week, it requires a follow-through price action by closing above the 16757. In any case, the Nifty closes above the 16757. The bullish engulfing on a weekly chart gets confirmation for a bullish reversal. The targets are placed at 17031 (40 week moving average) and 17011 (50 per cent retracement of the prior fall). It needs a lot of conviction on the upside with strong buying support. We cannot forecast more than this level at the moment. A majority of the rally from 15671 is because of short-covering.
The Nifty has not formed a higher high or a higher low to give the bullish reversal clue. Any big decline needs to form a base before it enters into a decisive trend. Retesting of the prior breakdown point (16840) is possible in any bear market conditions. The last two days of price actions lack the conviction to move higher. On Thursday, it formed a bearish belt hold candle, and on Friday, it traded within the previous day range. This 16448-757 zone will act as crucial for future trends. A close above or below this zone will give the directional bias of the movement. As the 200EMA (currently at 16691) acted as a strong resistance for the last two days, it also began to trend down. The 200DMA is placed at 16966 is another resistance very nearby. These technical parameters show that there is limited room for upside.
The daily and weekly RSI (46.37 & 45.42) are still in the neutral zone and within the downward channel. The weekly MACD declined below the zero line. Even after the last week's positive closing, the histogram has not declined much. The monthly MACD is about giving a fresh sell signal. It is a sign of bearish momentum still strong. The negative directional movement indicator -DMI is on the top, is also an indication of presence bearishness. The Mansfield relative strength indicator is exactly on the zero line. The index is failed to move above the Anchored VWAP resistance. Interestingly, the Nifty future volume indicates that the short term trend is exhausted. The lowest volume was recorded on Friday. The price rise on a lower volume will not give any conviction on the move.
In any case, the Nifty sustains below the 16840, and the bearish view remains intact. The recent low of 15671 is an important support and close below this level, will test immediately 15250. The bear market's ultimate target is at 13950. It will reach sooner or later. The Nifty has formed a monthly lower low candle in February. With this in all time frames, the market has entered into a confirmed bear market. It is also trading below the long term trend indicator, 200DMA. The downtrend in 200EMA means we are in a long term downtrend. The correction of over 13 per cent from the pivot is the highest since March 2020. The earlier corrections were limited to 10 to 11 per cent. The Classical technical analysis principles and the pattern target show the targets at least 50 - 60 per cent of the last two years' rally, which is below 14000 levels.
The strategy is simple. Do not buy this market as the targets are much lower. Look for selling opportunities for trade for next week. The short-term bounces may hurt the positions.
(The author is Chief Mentor, Indus School of Technical Analysis, Financial Journalist, Technical Analyst, Trainer and Family Fund Manager)

