Pullback this week more likely
NSE Nifty is not showing any weaker signs as it is making higher highs; It closed above the prior swing high; It did not move below the previous day’s low during the last nine days; The 50DMA has finally entered an uptrend; The index is trading above all key long and short-term averages
image for illustrative purpose

The domestic equity market edges higher for a third straight week. The benchmark indices closed positively for all trading sessions for the second successive week. NSE Nifty gained 229 points or 1.30 per cent during the last week. BSE Sensex advanced by one per cent. The broader market indices outperformed last week. The Nifty Midcap-100 and Smallcap-100 advanced by 1.75 per cent and 1.51 per cent. The Nifty Realty and Auto indices were the top gainers with 5.25 per cent and 3.6 per cent, respectively. The Nifty IT was down by 1.7 per cent, and the Media index is declined by 0.59 per cent. The Advance-Decline Ratio is positive. FIIs continued buying the equities all the session. They bought a total of Rs4,959.72 crore, and the DIIs sold Rs2,683.95 crore worth of equities in the current month.
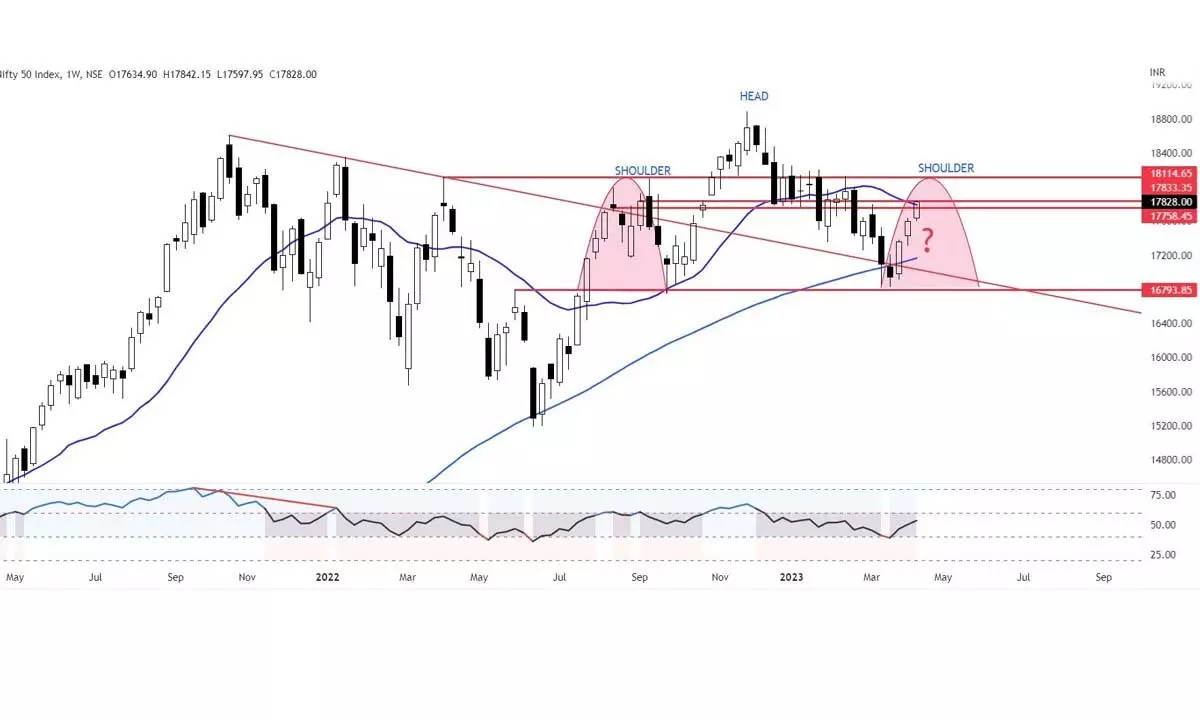
The Nifty rallied by 1,014 points or 6.02 per cent from the 20th March low of 16,828 points. This extraordinary impulse move surprised many traders. The surprise was because of a rally without fundamental support. The longest and sharpest rally in recent history has created the most optimistic scenarios. There are arguments for a 2000-point decline that has taken 70 sessions, but in just less than 10 sessions, it retraced 50 per cent of it. The fact is that the current swing comes from oversold conditions and mostly on a short-covering and with below-average volume. The counter-trend rallies in a downtrend market are typical and sometimes impulsive. The previous counter-trend rally was 781 points or 4.5 per cent during Jan-Feb, also three weeks old or 11 sessions, with small pullbacks. The current retracement is without pullbacks and in lesser time. All the sharper rallies will attract pullbacks sooner or later. Sharper the rally, sharper the pullbacks. So, expect a pullback next week.
As we forecast, the right shoulder formation is 90 per cent done. We expected that the right shoulder top might form at 17758 or 17833, or at 18114 (which is left shoulder high). The first two levels were achieved. Now, the question is will it test the 18114? In a classical technical analysis of price patterns, the symmetry in shoulders is usually a good clue to the veracity of the pattern formation, which means two shoulders appear at about the same price level. It may not be, also. The first two levels (17,758 and 17,833) are the closing highs of the left shoulder. Within this shoulder, it formed a double-top pattern too. If the history repeats or the price ties to get the symmetry, expect a four per cent decline from now and bounce towards the 18,114 level before completing the right shoulder top. This means two-leg swings, i.e., low-high, may be formed next four weeks. These short-term, maximum of two and three-week swings will decide the future long-term direction of the market. In another sense, the upside is limited, and we expect to move between the 17,850-17,165 zone for the next 2-4 weeks.
Another principle is that the price moves in trends, never in a straight-line fashion. Unless there is a base formation and a breakout, we can’t assume that the trend has decisively reversed on the upside. To get a confirmation for an uptrend, the higher swing high is not enough, and it must also form a higher low. If the pullback is realty, a move below 17,600 points, which is a 23.6 per cent current upswing, and the previous week's low, will give a confirmation. This pullback can extend towards 17335 and 17215, is almost equivalent to a double-top valley point in the left shoulder.
The Nifty is not showing any weaker signs as it is making higher highs. It closed above the prior swing high. It did not move below the previous day's low during the last nine days. The 50DMA has finally entered an uptrend. The index is trading above all key long and short-term averages. The RSI is in a strong bullish zone. MACD shows a bullish momentum. After all these strong evidences, there are some elements of doubt are there. The Nifty has formed three indecisive, exhaustion candles in the last four days. The latest hanging man candle at the swing is not a good sign.
Most importantly, the VIX is at record lows again, which also shows that the trend is at the mature stage. We have given the reasons for an inverse relationship between VIX and the benchmark index in the previous columns. Notably, the earnings season kicked off on a negative note. Both IT majors disappointed the street. The market is not expecting a good quarter. During the next four weeks, apply a range and neutral strategies, and reduce the leveraged positions.
(The author is Chief Mentor, Indus School of Technical Analysis, Financial Journalist, Technical Analyst, Trainer and Family Fund Manager)

