Profit booking likely as market in overbought zone
However, indicators don’t signal any bearish signs
image for illustrative purpose

17224-387 will become a strong zone of support. As long as it trades above this zone, be with a positive bias and avoid short positions; to exit the existing long positions, use tight stop losses, according to risk appetite
The domestic market starts the new financial year on a strong note. During the last financial year, the benchmark index, NSE Nifty, was up by 18.7 per cent. Last week, the Nifty advanced by 3 per cent on a strong buying interest from institutions. BSE Sensex is also up by 3.3 per cent. The broader market indices, Nifty Midcap-100 and Smallcap-100 up by 2.9 per cent and 3 per cent, respectively. On the sectoral front, the Nifty Realty and the private bank indices were the top gainers with 5.7 per cent and 5.2 per cent, respectively. The Metal index was down by 0.4 per cent, and the Pharma index closed marginally negative. The market breadth is positive for the week. The volatility index, VIX, is down by 21.32 per cent and closed at a ten-week low. During March, the FIIs sold Rs43,281.31 crore, and DIIs bought Rs39,677.03 crore. On Friday, on the first day of the financial year, FIIs bought Rs1909.78 crore and DIIs sold Rs183.70 crore worth of shares.
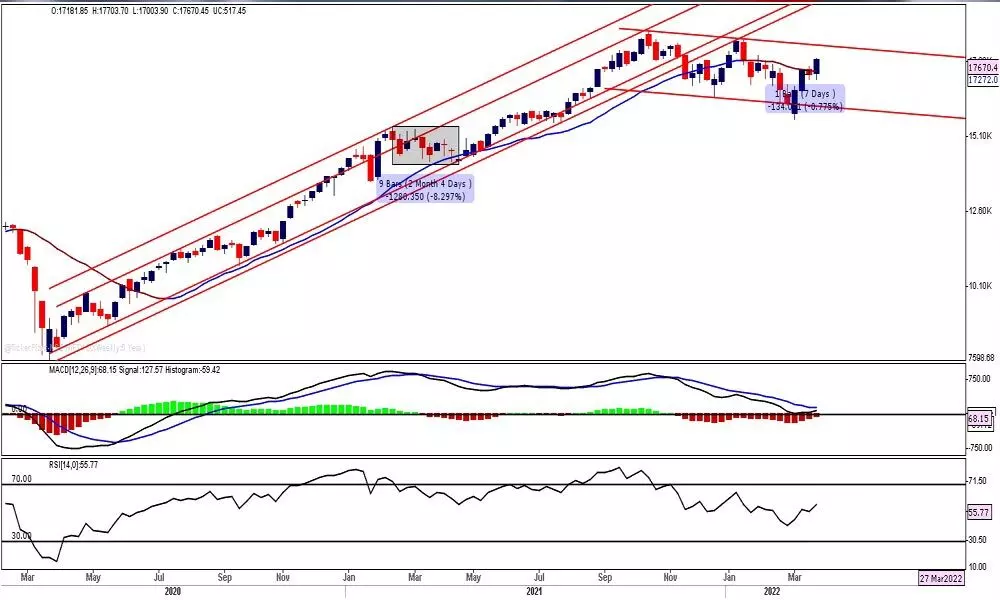
The Nifty finally came out of a 450 points consolidation rage, and it ended the week with a big bull bar. It closed at a five-week high. The Nifty also cleared the resistance, which acted as a support earlier. After honouring the 20 week resistance for two weeks, the index finally decisively crossed it and closed at a ten-week high. It closed at another channel's resistance. Interesting, it also formed a bullish engulfing candle and negated the prior day's bearish engulfing candle's implications. Since October 2021 high at 18604, there have been two impulsive upswings, and now both look similar as the index rose by 12 per cent, almost in the same time, period of 21 and 17 sessions. As it closed at resistance, a move above 17700 will take Nifty towards the 18000-18150 zone of resistance where the sloping trend line is present.
The breakout and the last five 3.9 per cent move in the last five sessions show the inherent bullish strength in the market. Three gap-up openings, shows strength. Now, the question is will it surpass the 17700-18000 area. The index reached the measured target, which equals the prior upswing. The price and time are met in the next four trading sessions. In the next four trading sessions, the Nifty may hit the 18000-150 zone of resistance. In such a case, the rally will be overstretched, and many of the indicators will reach an overbought zone.
The benchmark index is trading above the key moving averages on the indicators front. After February 15, the Nifty has moved 3.5 per cent higher to the 200DMA. Interestingly, after moving over 4.69 per cent to the 20DMA, the Nifty has declined. And even when the Nifty is at a lifetime high at 18604, the distance between 20DMA is exactly 3.69 per cent. Currently, the distance between Nifty and the 20DMA is 4.34 per cent. Generally, the price moves more than 3.7 to 4 per cent to the 20 DMA; the price comes to the average again. So, it is time to be cautious at the current juncture. The CCI indicator, which shows market tops and bottom prior to the form, is also extremely overbought. Another important metric is that the percentage Bollinger line also shows an overbought condition. The 14-period RSI has reached a strong bullish zone, and the MACD line is above the zero line. The Stochastic Oscillator is in an extreme overbought condition. As a majority of indicators show an overbought condition and an extended rally, the profit booking may come anytime from now.
But, the above indicators are not indicating any bearish signs. They show only caution. On the downside, the gap area of 17343-17387 will act as key support for now. For the last three days, the Nifty has formed a base around the 17387-17422 zone. And the 23.6 per cent retracement level is placed at 17224. It means 17224-387 will become a strong zone of support. As long as it trades above this zone, be with a positive bias and avoid short positions. To exit the existing long positions, use tight stop losses, according to risk appetite. 17387 may be the immediate trailing stop loss for the positional holdings. Since we expect the upside to be capped at the 18,100-150 zone and a reversal, traders should exit the longs near this zone and start approaching the market from the sell-side.
(The author is Chief Mentor, Indus School of Technical Analysis, Financial Journalist, Technical Analyst, Trainer and Family Fund Manager)

