Markets moving at lower level, rise in volatility may cause downfall
The broader market out-performance continued as the Midcap-100 and Smallcap-100 gained by 0.5% and 2.2% respectively
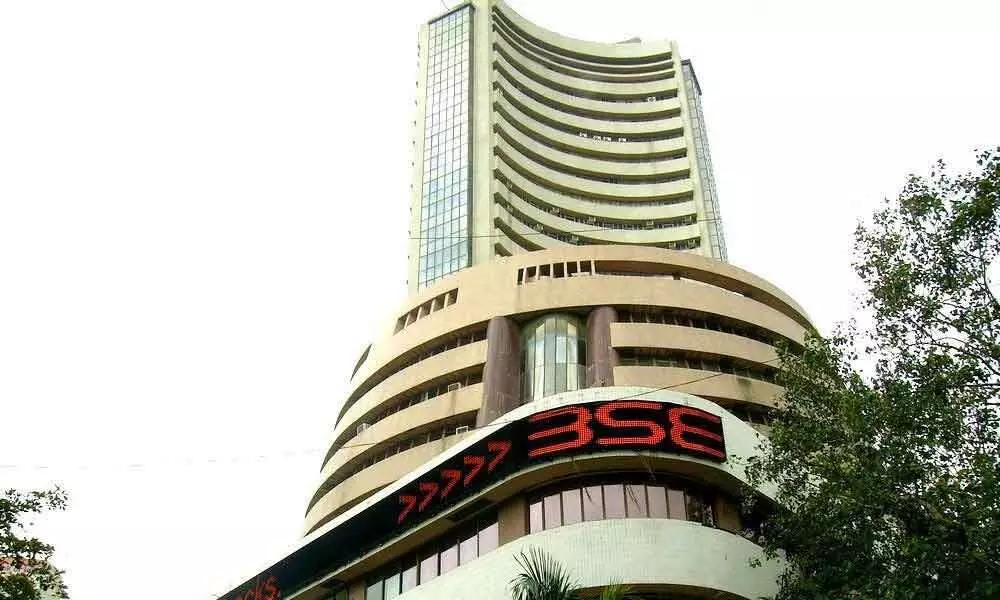
image for illustrative purpose

The domestic equity market edged lower on historically low volatility. The NSE Nifty benchmark index traded in the range of 15,636-15,915 points and closed at 15,722.20 points with 138.15 points or 0.87 per cent. The BSE Sensex declined by 0.8 per cent. The broader market out-performance continued as the Midcap-100 and Smallcap-100 gained by 0.5 per cent and 2.2 per cent. On the sectoral front, the Nifty Pharma and FMCG advanced by 3.3 per cent and 0.6 per cent. All the other sectoral indices down by 1.5 to 1.8 per cent. The overall market breadth is almost 1:1 during the week. FIIs sold Rs.3796.07 crores, and DIIs bought Rs6418.3 crore worth of equities last week.
Another attempt has failed to cross the 15,900 barrier. It formed a bearish belt hold as it failed to cross the opening level during the week. The gap-up opening at 15,915 points created some hope initially, lasted only a few minutes. For the first time after March, the Nifty registered four consecutive negative bars. With this, it formed a dark cloud cover like a candle. The current five-week consolidation is limited to less than 500 points; it is less than 250 points. If you remember, the 9-week consolidation during March-May is 1,000 points, and after the breakout, it has given a return of almost 1,000 points in just four weeks. This has proven the historical fact, and the flat consolidation breakouts will give a faster move on either side.
The previous consolidation occurred when the index fell by 8.3 per cent from the top. The present consolidation is at the new lifetime high after a 12.33 per cent rise from the recent bottom. Like earlier, this time too, there are confusing moves by index, giving no clues on the direction. Three tops at the same level and several bearish patterns failed to the confirmation. The Nifty not formed a lower high on the weekly chart, and it did not close below the previous week's low. The benchmark index maintains the higher high and higher low, which is a clear uptrend sign as per the very basic Dow theory. There are no confirmations for any of the bearish patterns or signs, or warnings. But, we need to take some more price internals to forecast the future outcomes.
The NSE Nifty is trading in a tight range for the last five weeks. This price action has resulted in Bollinger Band contraction. This volatility indicator suggests that, whenever there is a contraction in the volatility, expect an impulsive expansion too. It says the other way of flat base breakout outcome. At the same time, the VIX is at 18 months low, and the Implied Volatility (IV) is also at the lowest level. This is a warning sign like a Red light at the crossroads for the speeding bulls. These volatility indicators have an inverse relationship with the index. As these are at the historical lower level, any rise in volatility may cause a serious downfall in the index. This means, the Nifty fails to surpass the 15,900-16,000 level decisively; it may experience a volatile profit taking at every high.
There is classic distribution happening at the higher levels. The distribution day count currently at four. Any addition to this number will be another negative for the index. The market breadth shrunk as the fewer number of stocks are advancing than the declines during the week. The participation from the big investors is lagging. The foreign institutional investors (FIIs) turned sellers last month. The data shows that institutional participation is at the lowest level in the recent past. This means the demand is lower than the supply. This ultimately limits the market upside move.
There is no change in indicators stance. The negative divergences are still clearly visible. The weekly RSI once again reacting from the resistance. The +DMI shows a fresh negative divergence. MACD histogram indicates a flat momentum. In this kind of sluggish environment, it is difficult to make a decision. The market tests the patience of participants.
For next week, 15915-15600 are the key resistance and support levels. With the last hour short-covering resulted in a hammer candle formation. Let us wait and watch for confirmation of this bullish candle. In any case, it fails to get a confirmation by closing above 15738, and the market may witness another round of selling pressure. A close below 15,635-615,00 zone is a big negative for the broader market. The next level of support is at 15431. Only a decisive weekly close below this level, the market bias changed to a downtrend. Till then, the stock-specific activity will move. It is time to refrain from the fresh long positions and keep trailing stop loss to protect the existing portfolio.
(The author is financial journalist, technical analyst and family fund manager)

