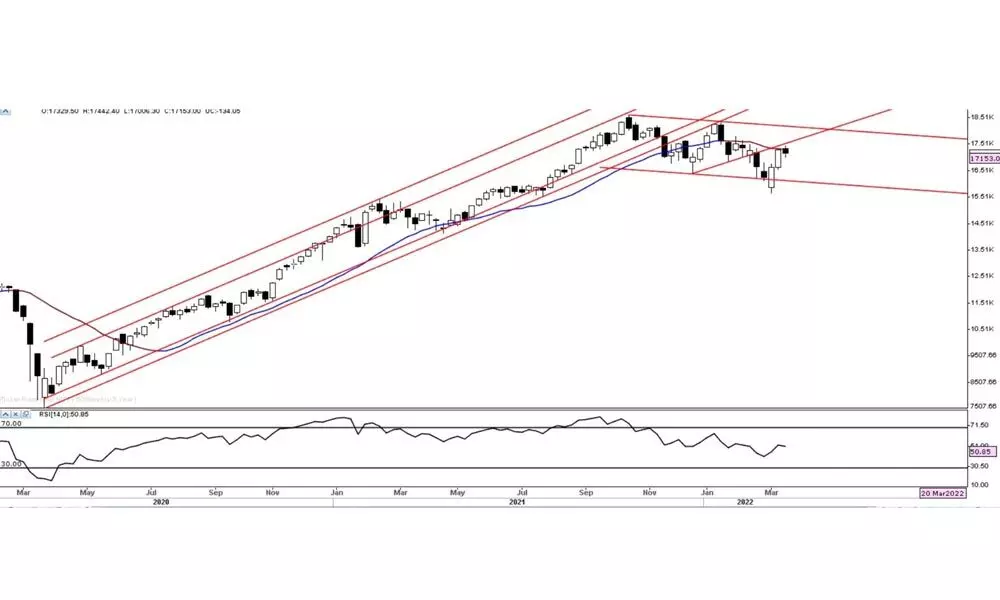
Market may continue in 16950-17450 zone for next week
The current upswing equalled the December-January swing of 11.93% of 21 trading sessions by moving 11.30% in just ten trading sessions. There are at least two Engulfing candles in the last six sessions and two dark cloud cover candles. These candles within the sideways ranges show indecision or lack of conviction on the upside
image for illustrative purpose

The Dalal Steet halted a two-week rally in a highly volatile range-bound trade. After trading in 436 points range, the benchmark index, Nifty, settled with 134.05 points or a 0.76 per cent decline. The BSE Sensex declined 0.9 per cent. The Broader market indices Nifty Midcap-100 and Smallcap-100 outperformed by one per cent and 0.3 per cent respectively. Nifty Media and the Metal indices were the top gainers with 6.9 per cent and 5.1 per cent. The FMCG and Financial services indices are down by 3.4 per cent and 3.1 per cent. The Bank Nifty declined by 2.79 per cent. FIIs sold Rs46,961.57 crore, and the DIIs bought Rs34,440.74 crore during this month. Overall, the market breadth is mostly negative. Surprisingly, the volatility index or fear index was just up by 3.63 per cent even though there was higher volatility on an intraday basis.
The benchmark index is traded in the zone at 61.8 per cent retracement area and faces multiple resistances. The weekly range has shrunk to just 434 points after the previous weeks' 1086 and 790 ranges. As we forecast, the sideways action of the market may continue for another one or two days. The index oscillated around 50-day Simple Moving Average for the last six trading sessions on a daily chart. An attempt to move about 100DMA failed on March 23. The distance between 50DMA and 200DMA is also shrinking. Interestingly, about 23 stocks of Nifty-50 stocks 50DMA is below 200DMA. This means the long-term trend of these stocks is bearish, which is also called Death Cross. Even if the majority of index stocks trade with the Death Cross means, the market is in a serious bearish mode. As stated above, if the 50 DMA of Nifty-50 also declines below 200DMA in the near term, the overall market structure also turns long-term bearish.
The current upswing equalled the December-January swing of 11.93 per cent of 21 trading sessions by moving 11.30 per cent in just ten trading sessions. There are at least two Engulfing candles in the last six sessions and two dark cloud cover candles. These candles within the sideways ranges show indecision or lack of conviction on the upside. At the same time, the support line drawn from December 20 and January 25 has become resistance in the last week. This kind of resistance is generally honoured by the market. Because of this, the 17442 is herculean resistance to cross. Forming the bearish belt hold candle on Friday indicated the bearish intentions. But, the only concern is that the confirmation is due.
In any case, the Nifty decline below the 200DMA (17036) and the 23.6 per cent retracement level of the current upswing (17024), the market will get bearish confirmations. On a lower time frame chart, the Nifty has formed the lower high after breaking down the rising wedge. This is the first sign of exhaustion. It needs to form a lower low by closing below 17076 and 17006 zones. If the Nifty closes below the 16837, which is gap area support, the next level of support is at 16717, which is 20DMA. Another important average, 21 EMA, is placed at 16957. As there is a cluster of supports around the 17000 zone, it is important to sustain above this to continue the bullish bias. It also needs to cross the 20 weekly moving average placed at 17294 to gain strength.
On the indicators front, the daily 14 period RSI (50.85) is in the neutral zone. Currently, there are no divergences visible. But, on the 75-minute chart, there is a negative divergence and needs confirmation for its implications. On the same chart, the MACD line is just hanging around the zero line, and any decline below zero will give us more clarity on the downward move. The weekly MACD is still below the signal line and zero line. The daily negative movement indicator -DMI is dominating on the chart, and the ADX is declining, which is a sign of not enough strength in the current trend.
As stated above, the market may continue within the 16950-17450 zone for next week. The monthly derivatives expiry is also scheduled for this week. In any case, the sideways range further extended, it's better to have a highly cautious view. Until either of the sides is taken out, it is better to apply the neutral strategy.
(The author is Chief Mentor, Indus School of Technical Analysis, Financial Journalist, Technical Analyst, Trainer and Family Fund Manager)

