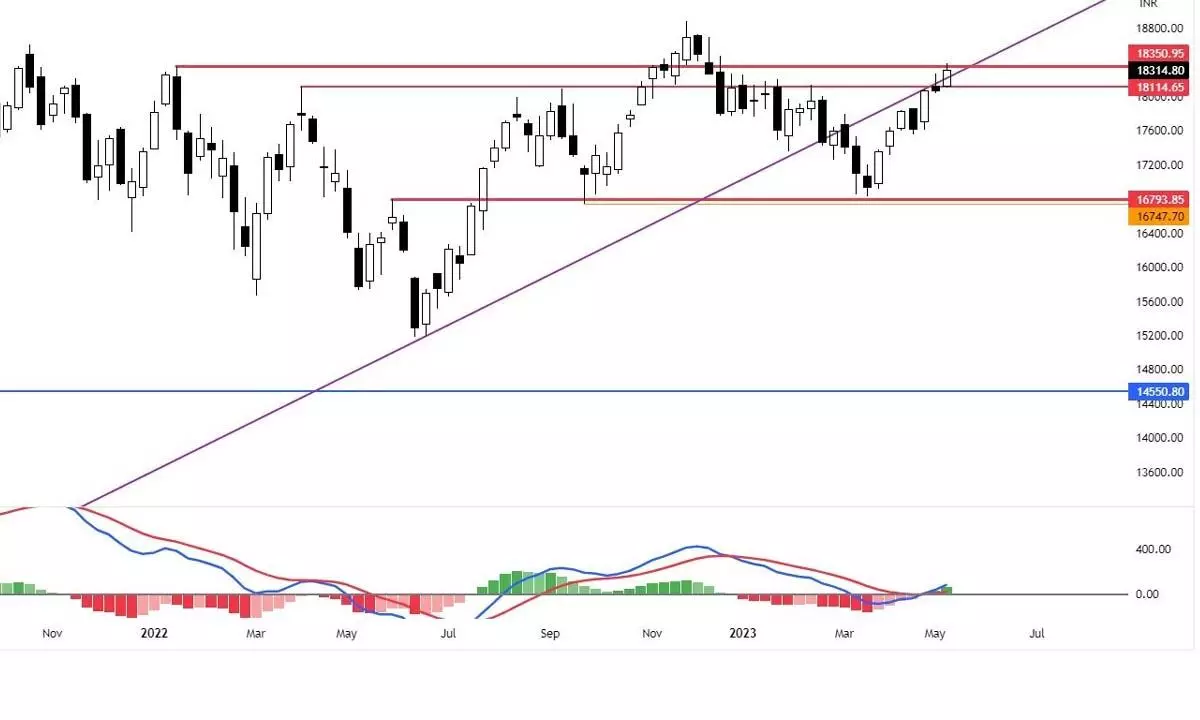
Charts indicate indecisive, bearish impetus
The market may open with a gap down as the ruling party lost in the Karnataka State elections; The selling pressure may continue if the gap-down euphoria sustains and fails to recover; In any case, Nifty closed below Friday’s low of 18,194 points and it’s negative
image for illustrative purpose

NSE Nifty edged higher for the third successive week supported by positive global cues as the US stock markets ended higher. Further, positive earnings from some large-cap companies also strengthened the investor sentiment. The Nifty traded in the 289.40 points range and finally ended with 245.80 points or 1.36 per cent gain. BSE Sensex also gained by 1.59 per cent. The Nifty Midcap-100 is up by 0.80 per cent, and the Smallcap-100 index is down by 0.20 per cent. On the sectoral front, the Nifty Auto index is the top gainer with 4.23 per cent. The Nifty IT and Pharma indices are up by 0.39 per cent each. On the downside, the PSU Bank index is down by 4.28 per cent and Metal declined by 2 per cent. The Market breadth is mostly positive. The India VIX is up by 4.94 per cent to 12.85. The FIIs continued to buy the equities, as they bought Rs13,278.11 crore worth of equities this month. The DIIs sold Rs3,997.23 crore worth of equities.
The Nifty failed to get a confirmation for the bearish implications of the previous week’s Shooting Star candle. On Monday, it opened higher with support of global cues and formed a strong bullish candle. But the next four days, it traded in a defined range. Though it closed positively, it formed one indecisive and two bearish candles. Before the event risk (Karnataka State election results), the market participants were nervous about going long aggressively. The Nifty took support at the rising channel demand line and the previous swing.
This confluence of support is crucial on a closing basis. Index has not given any reversal signs. It is trading above all key moving averages, and all of them are in an uptrend. The pattern analysis shows that the Nifty can test the 18,500-18,600 zone in the short term. If this can be a reality, the October 2020 high of 18,604 and November 2022 high of 18,887 can become a triple top. As mentioned earlier, the Head and Shoulder pattern is formed, but the symmetry is missing in the right shoulder. If we consider 1-2 per cent whipsaw, it is still valid. If the Nifty crosses the head (18,888), the pattern is no more valid.
The weekly MACD has finally given a bullish signal by crossing the signal line above the zero line. The RSI (59.58) is almost at 60. The daily Commodity Channel Index shows that indicates marker cycles and shows that the index is almost made its top.
The global indices lost momentum and erased most of the gains due to concerns about rising inflation and interest rates. But there are some headwinds in the next week, with a downside risk. The market may open with a gap down, as the ruling party lost in the Karnataka state elections. The selling pressure may continue if the gap-down euphoria sustains and fails to recover. In any case, the Index closed below Friday’s low of 18,194 points, it is negative, as it breakdown the rising channel pattern. At the same time, the Bollinger bands show an extension of a trend.
The Indian economy is showing signs of slowing down, as the IIP data indicates. India’s industrial production rose 1.1 per cent in March. Consumer durables (-8.4 per cent) contracted for the fourth consecutive month, and output of consumer non-durables (- 3.1 per cent) shrank for the first time in five months in March, signaling continued weakness in consumer demand. On the other hand, the India VIX rose throughout the week, and so did the Index.
Over the past several weeks, the persistently low levels of VIX have remained a concern; this volatility gauge violated its pre-pandemic 2020 lows, when it closed below 11 level. This indicator also rose; the markets continued to pile up some gains as well. The low VIX is not good for a trending market. There are several factors not supporting the logic behind the current uptrend. Any decline with high volume is impulsive. Importantly, no sector is in a position to lead the market now. All the sector indices are losing their momentum and relative strength. The stock-specific activity is leading the market now.
On Monday, the first hour levels are crucial for a trend to continue. If the Index crosses the first hour high, the trend will continue, and breaking below the low means negative for the market. If it trades within the first range for the day, it means there are chances to recover in the next few days. In this scenario, one must continue to be selective and stock specific. Stick to low volatile and high relative strength stocks.
(The author is Chief Mentor, Indus School of Technical Analysis, Financial Journalist, Technical Analyst, Trainer and Family Fund Manager)

