Can Nifty touch a record high this week? Reports
Nifty on Friday took out its previous swing high and formed a bullish candle on the daily chart. On the weekly chart, the index also formed a bullish candle with a long lower wick, suggesting intra-week selling was bought into. One can expect further upside ahead, said analysts.
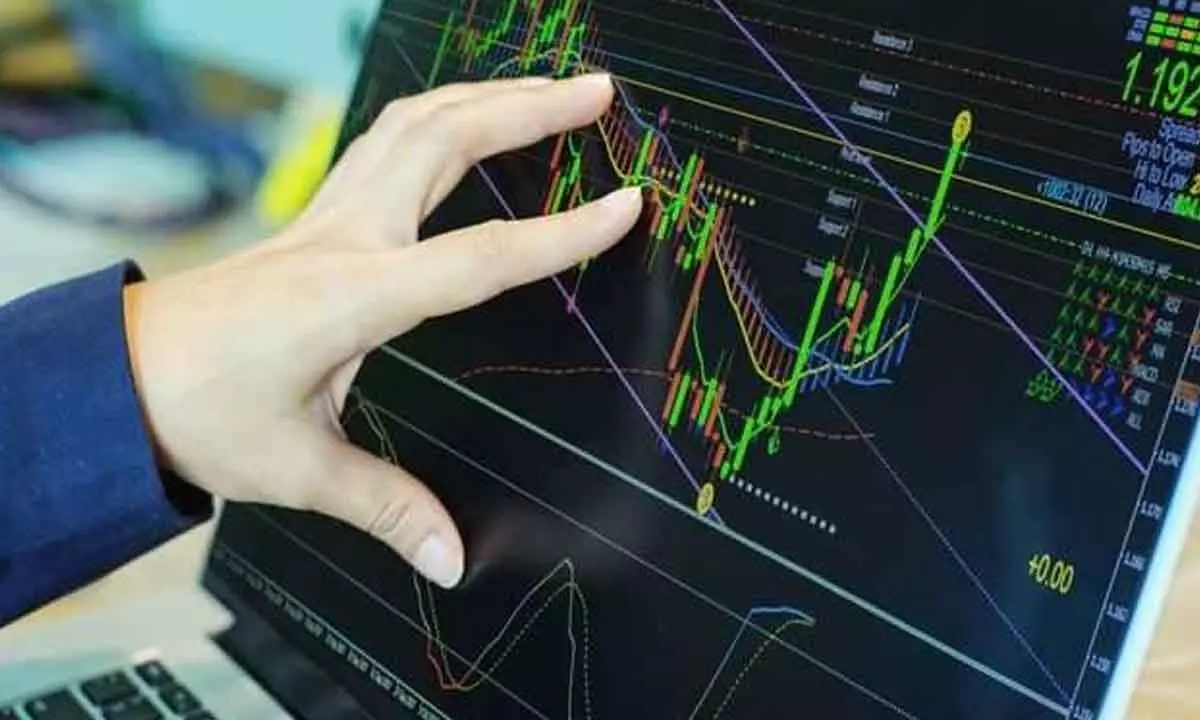
image for illustrative purpose

Nifty on Friday took out its previous swing high and formed a bullish candle on the daily chart. On the weekly chart, the index also formed a bullish candle with a long lower wick, suggesting intra-week selling was bought into. One can expect further upside ahead, said analysts.
Nagaraj Shetti of HDFC Securities said after a 244-point gap-up opening on Friday, Nifty continued with its upside momentum for the better part of the session. A long bull candle on the daily chart with a huge unfilled gap-up and a decisive close above the key hurdle of 18,150 is a positive indication, he said.
The index is now also placed at the edge of another resistance of 18,350 levels (top of January 18).
"On the weekly chart, Nifty has decisively crossed its important resistance of the previous top at 18,150 level. Hence, further upside is likely from here and one may expect new all time high above 18,600 levels in the near term. Immediate support is placed at 18,150," Shetti said.
On Friday, Nifty50 closed at 18,349.70, up 321.50 points or 1.78 per cent. For the week, the index gained 1.28 per cent.
Chandan Taparia of Motilal Oswal Securities said that the index has been forming higher lows for the last six weeks and that it needs to hold above the 18,300 level for an up move towards 18,500 and 18,600 levels. Supports for the index are placed at 18,188 and 18,088 levels, Taparia said.
Rupak De of LKP Securities said the trend looks positive as long as the 18,300 level is held on a closing basis.
"On the higher end, Nifty may move towards 18,600 in the near term. On the lower end, support are pegged at 18,200 and 18,000 levels," he said.

