Stay on the sidelines until the directional bias emerges
Weekly RSI (52.14) is in the neutral zone; MACD line is below the signal line, which is a fresh bearish bias; daily ADX (26.78) shows the strength of the bears
image for illustrative purpose

The first week of 2023, starting with a negative note, will all-round selling pressure. NSE Nifty declined by 245.85 points or 1.36 per cent. BSE Sensex is also down by 1.6 per cent. The FMCG, Pharma, and Auto indices gained 0.10 - 0.8 per cent. The Nifty IT and Media indices are down by 2.3 per cent. The Nifty Midcap -100 was down by 0.3 per cent, and the Smallcap-100 declined by 0.8 per cent. Overall, market breadth is negative. The FIIs are continuously selling in the new year too. They sold Rs7,813.44 crore worth of equities in the last five trading sessions. The DIIs bought Rs2,756.58 crore.
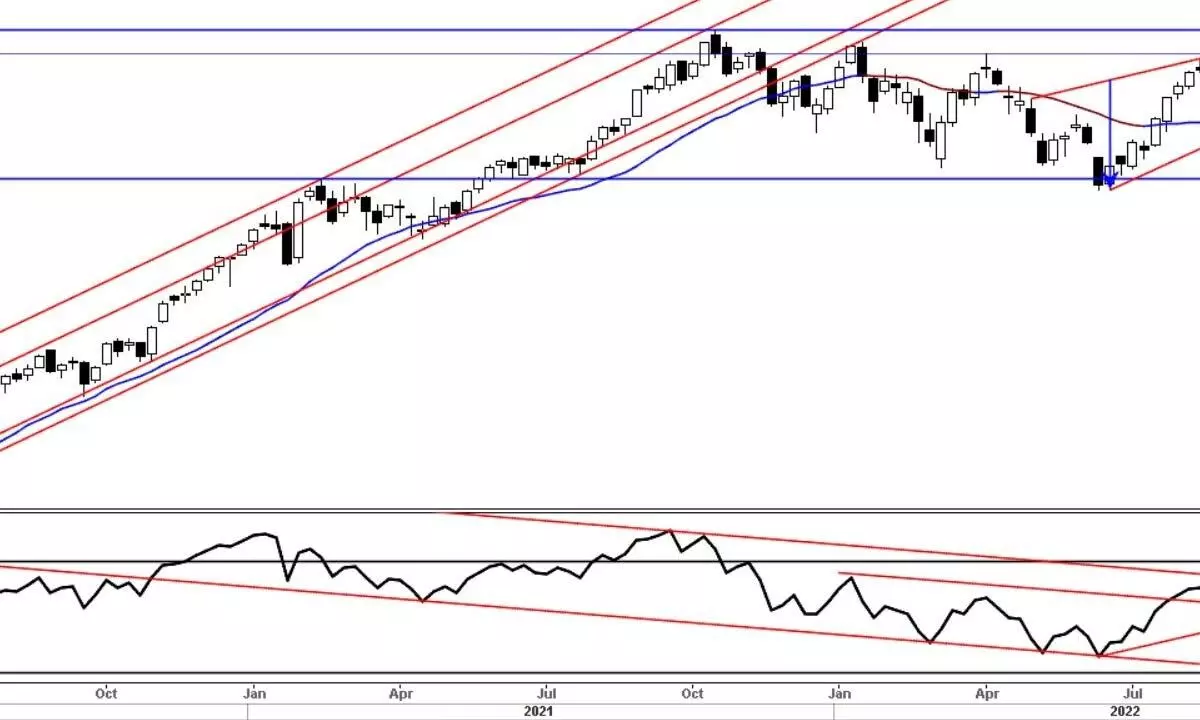
The Nifty has formed another inside bar on a weekly chart. The 10-week moving average acted as strong resistance for the second consecutive week. Importantly, the frontline index declined below all key moving averages. It broke below the 100DMA, and 20-week moving average, which acted as a major support on earlier occasions. The 20DMA cross under the 50DMA, which is short-term negative. The Daily RSI is below 40 and entered into a bearish zone. As the Nifty formed an inside bar, the previous low of 17774 has become a crucial support.
Only below this will cause the index to decline further low. Since December 1, on only five occasions, the Nifty closed above the prior day's high. We can categorise the last two weeks' price action as a consolidation. It needs close above the 18265-303 zone of resistance for an upside breakout. The behaviour around this zone is very crucial for the directional market bias. We may see a bounce on Monday because the decline was sharp in the last three days. Even positive global markets may support the sentiment. In any case, the Nifty opens with a positive gap on Monday; it has to sustain above the first hour's bar and close above the prior day's high. Sustaining below 17900 means the market is not in the mood to move higher and breach the 17774 support. Then the market status will change again to the downtrend from the rally attempt condition.
The price pattern analysis shows that the 1st December breakout was a false one, as the index formed a lower low. It corrected 5.9 per cent from the recent top. The earlier corrections were 7.45 per cent and 9.6 per cent. As it also broke the rising wedge pattern, the pattern targets are scary. Earlier, the Nifty corrected 18.4 per cent from October 2021 high. If the index witnesses the category-1 correction, it may fall at least 13-18 per cent. This is nothing, but testing the below 16747 levels, which is also a 61.8 per cent retracement level of the prior uptrend. The Nifty already closed below the 23.6 per cent retracement level. In any case, if it declines below 17774 next week, the next level of support is at the 38.2 per cent retracement level of 17472.
On the indicators front, the weekly RSI (52.14) is in the neutral zone and does show any divergence. The MACD line is below the signal line, which is a fresh bearish bias. The daily ADX (26.78) shows the strength of the bears. The index has attempted to move above the 50DMA, but failed. The advance-decline ratio is mostly negative during the week.
The FIIs have been selling continuously since December 1. They sold Rs2,78,429.52 crore last calendar year, which is more than 2.5 times compared to 2008 selling. At the same time, the market lacks the leading sector currently. Even the PSU Banks, which led the rally in Bank Nifty, also lost momentum. As the earning season begins this week, and the expectations are not so enthusiastic, we may see more stock-specific activity. Overall, market conditions are not conducive to building a new portfolio. Continue to be low position size until the directional bias evolved.
(The author is Chief Mentor, Indus School of Technical Analysis, Financial Journalist, Technical Analyst, Trainer and Family Fund Manager)

