Short covering likely this week
As the derivatives data suggests, we may see 19,000 as a strong support and 19,500 as a strong resistance zones, and may hold these levels till expiry
image for illustrative purpose

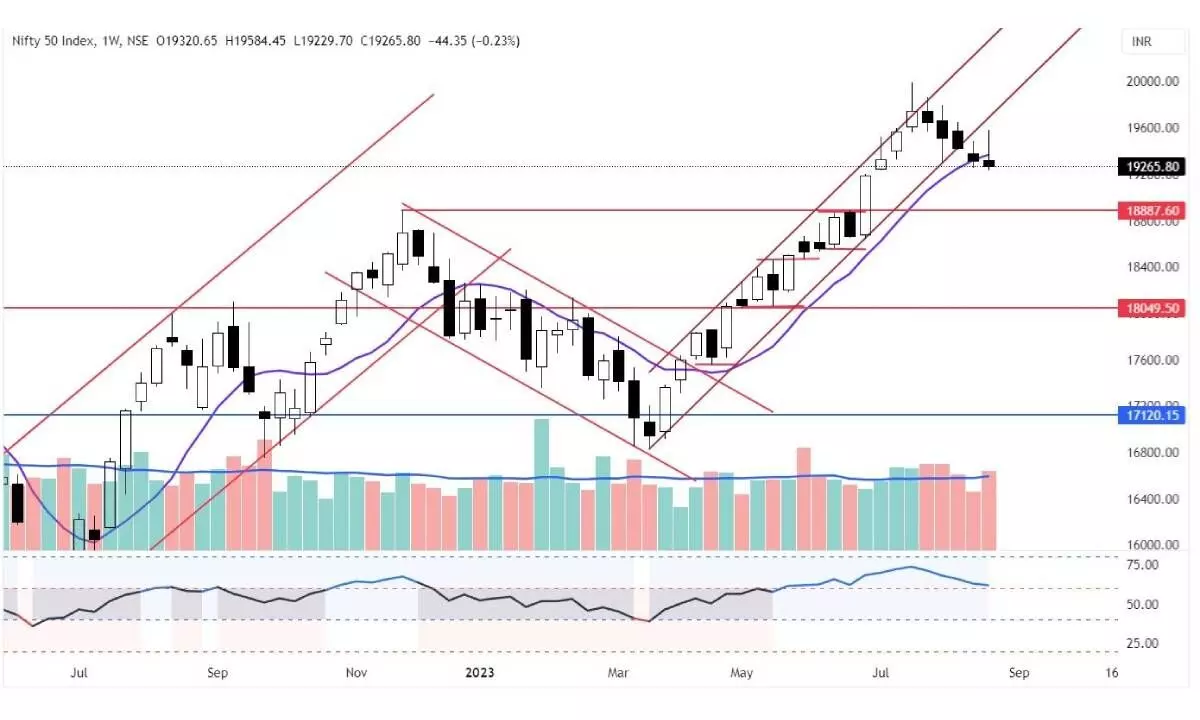
The equity market witnessed a huge selling pressure on the weekend. The NSE Nifty traded in the 354.75 points range during the, ended with a 44.35 points or 0.23 per cent decline. The BSE Sensex was down by 0.1 per cent. The Nifty Midcap-100 and Smallcap-100 indices outperformed by 1.7 per cent and 1.6 per cent, respectively. On the sectoral front, the Nifty Pharma, Energy, and PSU Bank indices are down by 1.0 to 1.5 per cent. The Nifty FMCG and Auto indices closed flat, and Bank Nifty, FinNifty, and IT indices were up by 0.8 per cent to 1.2 per cent. The FIIs sold aggressively on Friday by exiting Rs4,638.21 crore worth of equities. In the current month, FIIs sold Rs15,821.13 crore, and the DIIs bought Rs17,741.85 crore. The market breadth has been negative in the last two days. The India VIX declined by 0.45 per cent to 12.08.
The Nifty declined for the fifth consecutive week after Feb-March 2020 fall. It formed a big bearish candle with a long upper shadow and closed below the opening level. In the last two days of the impulsive fall, the index has erased the positive bias of the first three days. The volumes are higher than the previous two weeks. This is an indication of serious distribution. The index also sustained below the 10-week average for the second week. The 3.8 per cent decline from its top may be smaller compared to the March decline, but it has all the characteristics of breakdown of topping formation. The Nifty has formed lower highs and lower lows with a higher number of distribution days in the last 25 days. Four weeks of the last five weeks recorded above-average volume, which is a clear distribution sign.
The pattern analysis shows that the Nifty broke the descending triangle and the head and shoulders, not exactly the classical one. It also registered the sloping channel breakout. The Nifty has met less than 50 per cent of the rising channel breakdown. The index declined 0.56 per cent below the 50DMA and 1.15 per cent below the 20 DMA. The distance between these two moving averages was narrowed. Further decline in the index may result in a cross under. The 100DMA is at 18,761 points, which is equal to the 38.2 retracement level of the prior uptrend. It is just below the prior major swing high of 18,887 points.
The Volatility index, VIX, is almost unchanged at 12.08. On Friday, the fall with the highest volume and an increased open interest shows that aggressive short built up in the system. The monthly expiry may be quiet this time, and the premium erosion is already at the maximum level. As the derivative data suggests, we may see 19,000 as a strong support and 19,500 as a strong resistance zones.
The weekly RSI is at 61.70 and does not show any divergence. The daily RSI is 41.48, near the bearish zone, forming lower highs and lower lows. The weekly MACD is about to give a bearish signal. The daily MACD line is below zero and shows strong bearish momentum.
Relative Rotation Graphs (RRG) analysis shows that the Nifty PSE Sector and Energy indexes have moved into the leading quadrant. The Nifty Media, Metal, Pharma, PSU Bank, and Midcap100 sectors are in the leading quadrant, but the Metal and Healthcare indices are losing momentum. These sectors are likely to outperform the broader NIFTY 500 Index relatively. The IT and the Oil and Gas sectors moved into the improving quadrant with an increased momentum. The Nifty Services sector, Bank Nifty, and Financial Services index are inside the lagging quadrant. The FMCG index has also rolled inside the lagging quadrant.
The coming week will be crucial for the market. Will the present downtrend continue or reverse from the key support? The 19,000-19,500 may hold till expiry. There may be a possibility pause in trend, as it has already been corrected for five weeks. The stock-specific activity will continue, and we will see some short-covering spikes next week. The Rollover data will give clues about the trend continuation. Stay cautious and maintain strict stop losses on either side.
(The author is Chief Mentor, Indus School of Technical Analysis, Financial Journalist, Technical Analyst, Trainer and Family Fund Manager)

