What is a Bullish Harami Candlestick Pattern? Will Dalal Street open with a positive note on Monday?
What is a Bullish Harami Candlestick Pattern? Will Dalal Street open on a positive note on Monday?

A bullish harami is a candlestick chart pattern that indicates a potential reversal of a bearish trend, suggesting that it might be a good time for investors to consider entering a long position on an asset.
Candlestick Charts: An Overview
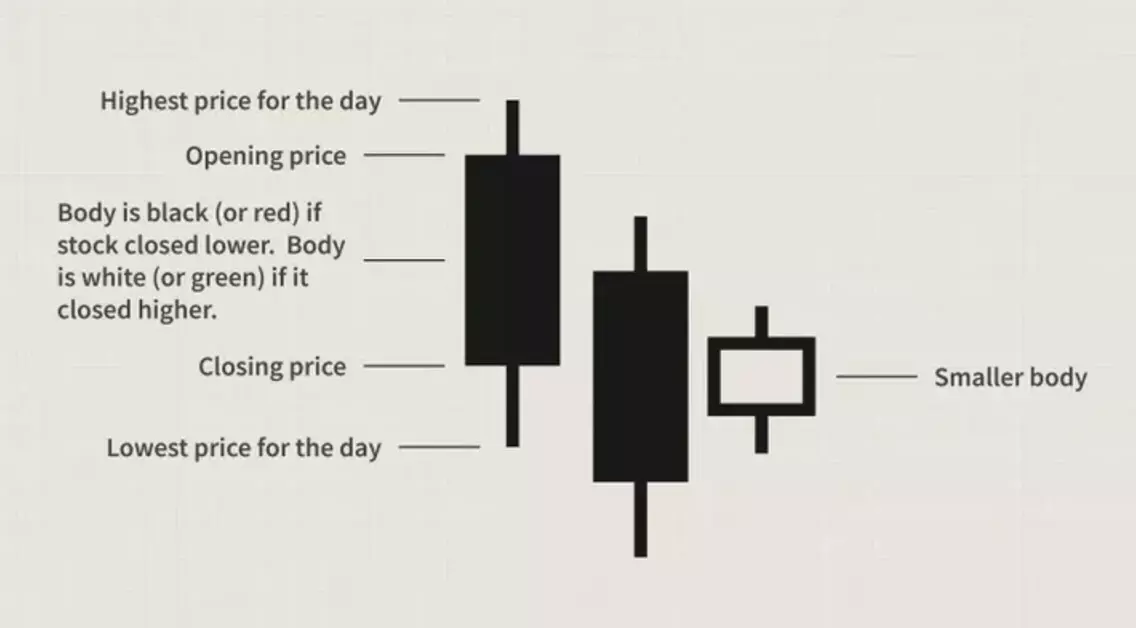
Candlestick charts are widely used to track the performance of securities. They are named for their distinctive rectangular shape with lines, or wicks, extending from the top and bottom, resembling a candle. Each candlestick represents a single day's price data, including the opening price, closing price, high price, and low price.
Identifying Harami Patterns
To spot a harami pattern, investors must analyze daily market performance using candlestick charts. Harami patterns form over two or more trading days. A bullish harami specifically signals the potential end of a downward price trend, with initial candles indicating continued bearish pressure pushing prices lower.
The bullish harami is characterized by a long candlestick followed by a smaller body, often called a doji, which is entirely contained within the vertical range of the previous day's body. This pattern visually resembles a pregnant woman, hence the term "harami," derived from an old Japanese word meaning "pregnant."
Bullish Harami Formation
For a bullish harami to occur, the smaller doji's body must close higher within the previous day's candle's body, indicating a higher likelihood of a trend reversal.
In the chart above, the first two black candles indicate a two-day downward trend, while the white candle on the third day shows a slight upward movement contained within the previous candle's body. This formation often encourages investors, as it signals a potential market reversal.
Candlestick Patterns: Beyond the Basics
Analysts use candlestick patterns to quickly interpret daily market performance and make informed decisions. The bullish harami and its counterpart, the bearish harami, are basic patterns predicting potential trend reversals. Other fundamental patterns include bullish and bearish crosses, evening stars, rising threes, and engulfing patterns.
For more sophisticated analysis, advanced candlestick patterns like island reversal, hook reversal, and san-ku (three gaps) provide deeper market insights.
By understanding these patterns, investors and analysts can better anticipate market movements and make strategic trading decisions.
Stock Market Outlook Post-Election Victory
With the BJP-led NDA securing a landslide victory in the Maharashtra Assembly Elections, stock market experts predict significant positive shifts in investor sentiment. As the market reopens on Monday, this political stability is expected to influence a strategic shift from defensive to aggressive investment approaches, particularly favoring sectors like railways, infrastructure, and banking.

