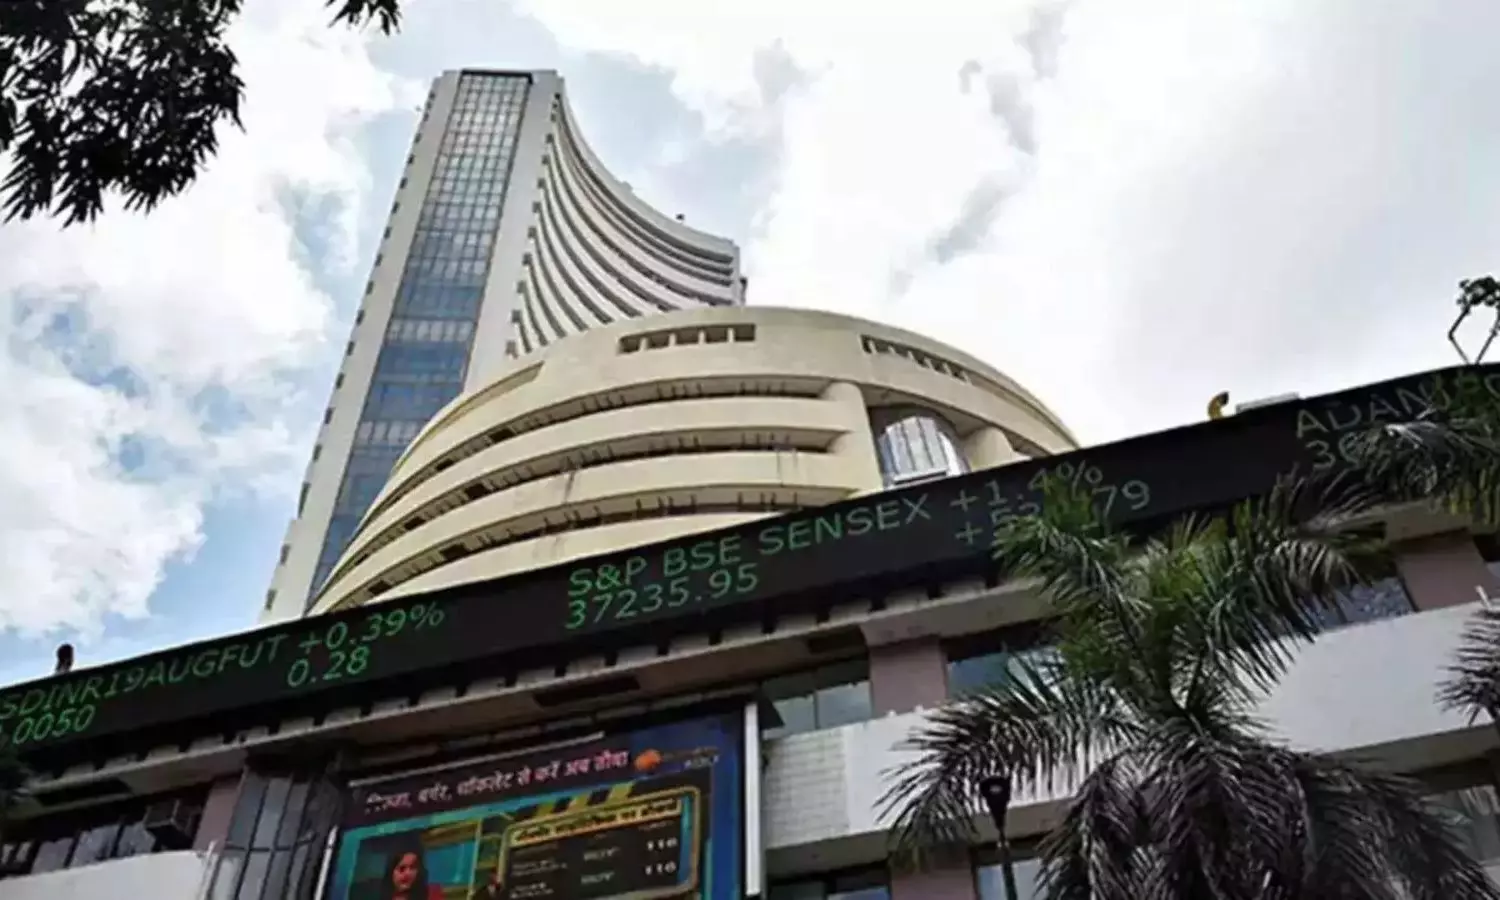
Trade Setup for January 6: Key insights ahead of the opening bell
Trade Setup for January 6: Key insights ahead of the opening bell

After a two-day rally, the market couldn't continue its upward momentum on January 3, as profit booking led the Nifty 50 to close 184 points lower on above-average volumes. However, the index managed to maintain the 24,000 level at the close, and if it holds above this level, it may face resistance between 24,200 and 24,250, which aligns with the 50- and 100-day Exponential Moving Averages (EMAs). A further rise could see targets of 24,400 and 24,800. On the downside, a breach of the 24,000 level would bring support at 23,900, with the key support zone lying between 23,750 and 23,700. Experts are suggesting a potential trading range for the Nifty next week between 23,700 and 24,500.
For the Nifty 50, key resistance levels based on pivot points are at 24,143, 24,195, and 24,279, while key support levels are at 23,975, 23,923, and 23,839. Additionally, the Nifty has formed a Bearish Belt Hold pattern on the daily charts, indicating a possible bearish reversal, though confirmation is needed in the upcoming session. On the weekly charts, the Nifty has formed a bullish candlestick pattern, signaling market indecision.
Turning to the Bank Nifty, resistance levels are pegged at 51,481, 51,662, and 51,955, while support is found at 50,895, 50,714, and 50,421. Fibonacci retracement suggests further resistance at 51,570 and 52,132, while support lies at 50,671 and 49,787. A long bearish candlestick on the daily charts and trading below key EMAs suggest weakness in the Bank Nifty, and the index continues to face indecision between buyers and sellers. Despite an attempt to surpass the midline of the Bollinger Bands, it has failed.
Regarding options data, the Nifty 50 shows maximum call open interest at the 25,000 strike, which serves as a key resistance level. The 24,500 and 24,200 strikes follow with significant open interest. On the put side, the 23,700 strike holds the largest open interest, suggesting it could act as a key support level. Similarly, the Bank Nifty has maximum call open interest at the 52,000 strike, while the maximum put open interest is at the 50,000 strike, which could provide crucial support.
Market sentiment is also gauged through the Nifty's put-call ratio (PCR), which has fallen sharply to 0.86, indicating a bearish mood. The India VIX, which measures market volatility, has dropped 1.44% to 13.54, providing some relief for bulls.
In terms of stock activity, 44 stocks saw a long build-up, 52 experienced long unwinding, and 100 stocks witnessed short build-up, indicating various trends across sectors. 31 stocks saw short-covering, which indicates renewed buying interest. Additionally, stocks with a high share of delivery trades are also attracting investor interest, reflecting a shift towards long-term investments.
Lastly, the F&O segment has placed Manappuram Finance and RBL Bank under the ban due to exceeding the market-wide position limit, signaling a risk for traders.
This summary offers a comprehensive view of key levels, trends, and options data to guide market decisions ahead of the opening bell on January 6.

