Sensex charts indicate further weakness
Technical correction is likely to continue below 63,100 and could slip till 62,700-62,500; Contra traders can take a long bet near 62,500 with strict 62,400 stop loss
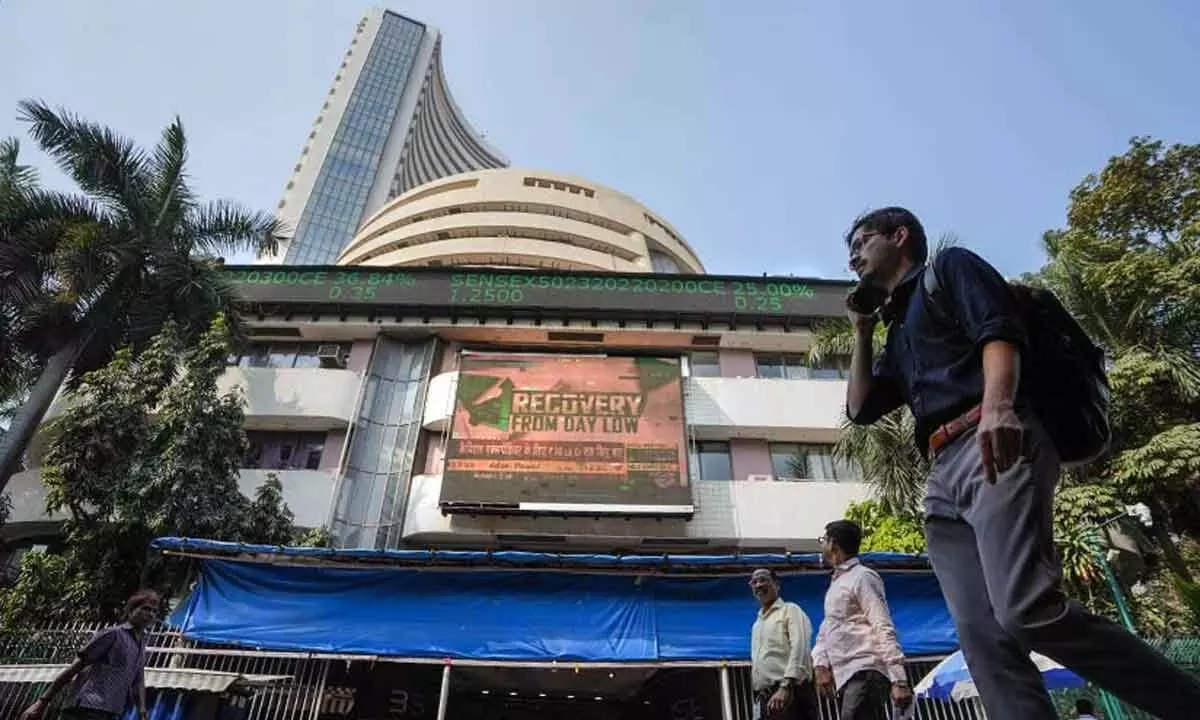
image for illustrative purpose

Kumud Das On the account of weekly expiry day, the benchmark indices witnessed profit booking at higher levels, BSE Sensex was down by 294 points. Among Sectors, Media and Reality indices corrected sharply, whereas despite weak market sentiment some buying is seen in selective metal and energy stocks. Technically, after early morning intraday rally, the market corrected sharply. On daily charts, it has formed long bearish candle, which indicates further weakness from the current levels. However, the medium term formation of the index is still in to the bullish side.
“For traders now, as long as the index is trading below 63,100, the technical correction is likely to continue,” says Shrikant Chouhan of Kotak Securities. Below which, the market could slip till 62,700-62,500. Contra traders can take a long bet near 62,500 with strict 62,400 stop loss.


