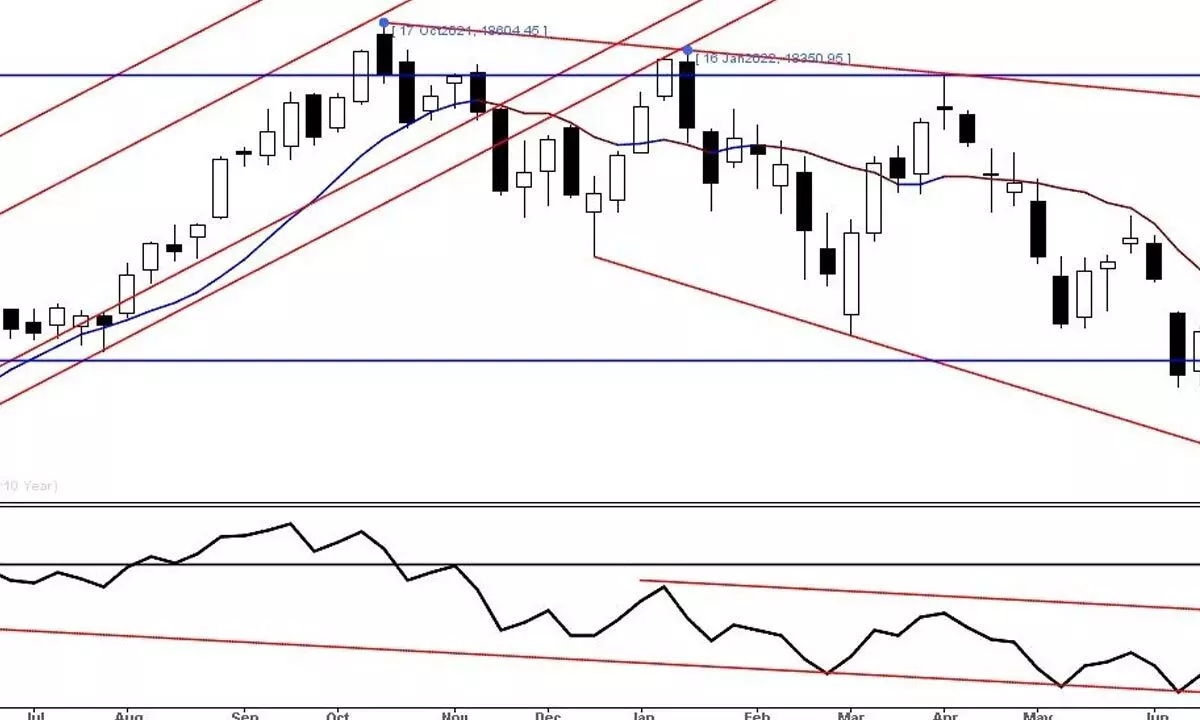
Price pattern indicates bearishness
If the Nifty breaks below 16980, the correction will continue to test the 16294 level
image for illustrative purpose

The ears about possible global economic recession are almost imminent as stated by many central banks last week, the global equity markets tumbled to new lows. The Indian benchmark index, NSE Nifty, also witnessed huge volatility, traded in the over 625 points range and finally settled with a net loss of 203.5 points or 1.16 per cent. BSE Sensex is down by 1.3 per cent. The broader market indices, Nifty Midcap-100 and Smallcap-100 are down by 1.3 per cent and 2.3 per cent, respectively. Only the FMCG sector index outperformed as it gained by 3.8 per cent. The Nifty Energy and Realty indices are down by 4.4 per cent and 4 per cent, respectively. The market breadth is broadly negative, as the declines are outnumbered by advances. The FIIs once again turned into sellers. They sold Rs2,445.82 crore and the DIIs also sold Rs1,868.54 crore worth of equities in September month.
The equity markets are looking very weak and going to register a big reversal. The Nifty closed lowest after 29th August and broke many key supports. Closing below the previous week's low with added distributions days and the bearish candlesticks means that the market is clearly in reversing mode. The Nifty has formed a long upper shadow candle, which can be categorised as a Shooting Star as it was at the confluence of highs. Importantly, the lower closing also confirmed the previous week's bearish engulfing implications on the downside.
In fact, the Nifty has broken down the double top pattern on a line chart, which is a reversal pattern at the top. Apart from these breakdowns, the index closed below the 50DMA and 34EMA decisively, which acted as support in the recent upside move. Declined 2.06 per cent below the 20DMA. The long-term trend indicator 200DMA is just 1.97 per cent. The Nifty also declined below the 23.6 per cent retracement level of the prior uptrend. Except for 29th August, the Nifty closed below several parallel supports. With this the 24-day consolidation has broken on the downside. The 38.2 per cent retracement level (16980) and the 200DMA (16993) are almost at a similar level.
The Anchored VWAP support is at 16920. This zone of 16920-993 is crucial for the market now. The current 24-day consolidation breakdown targets are placed at 16750. Before achieving this target, there can be many pullbacks we may see. Prior to that, the minor low is at 17166, which is immediate support. If the Nifty breaks below 16980, the correction will continue to test the 16294 level.
The broadening price pattern at the top is usually bearish. The current price structure of the Nifty is left angled, broadening the formation's support at the 13500-700 zone. This is exactly a 25 per cent correction from the top. We have mentioned this historical fact many times earlier, that the market may correct at least 25 per cent from the top. The historical evidence shows whenever the market doubled from the bottom, it was corrected by 25 per cent. From March 2020 to October 2022 high, the Nifty gained by 148 per cent. The impulse move has to correct at least 25 per cent, and The June low is almost 18 per cent correction. At the same time, All the major corrections were limited to 8 months or 13 months. Very few corrections extend to 18-21 months. We are already in the 11th month. The question is whether the correction will end by November or will it extend. Only time will tell the answer.
As mentioned earlier, the RSI and MACD have developed a serious negative divergence and got confirmation last week. The RSI has broken the prior lows and closed near the bearish zone. It also broke the descending triangle pattern, and the targets are much lower below the 30 zone. Several bearish candles on price got the confirmation along with negative divergence implications are in other confirms the reversal. As the Nifty declined sharply for the last four days, there is a possibility of some retracement on a lower time frame chart. But, these retracements can't be trusted as long as the price trades below 17900.
Next week, the global market behaviour is important for our market too. The S&P-500 took support at the previous swing low. Dow and Nasdaq indices are below the key supports. In these conditions, we better hold the existing short positions with trailling stop loss as per the risk and avoid long positions for now.
(The author is Chief Mentor, Indus School of Technical Analysis, Financial Journalist, Technical Analyst, Trainer and Family Fund Manager)

