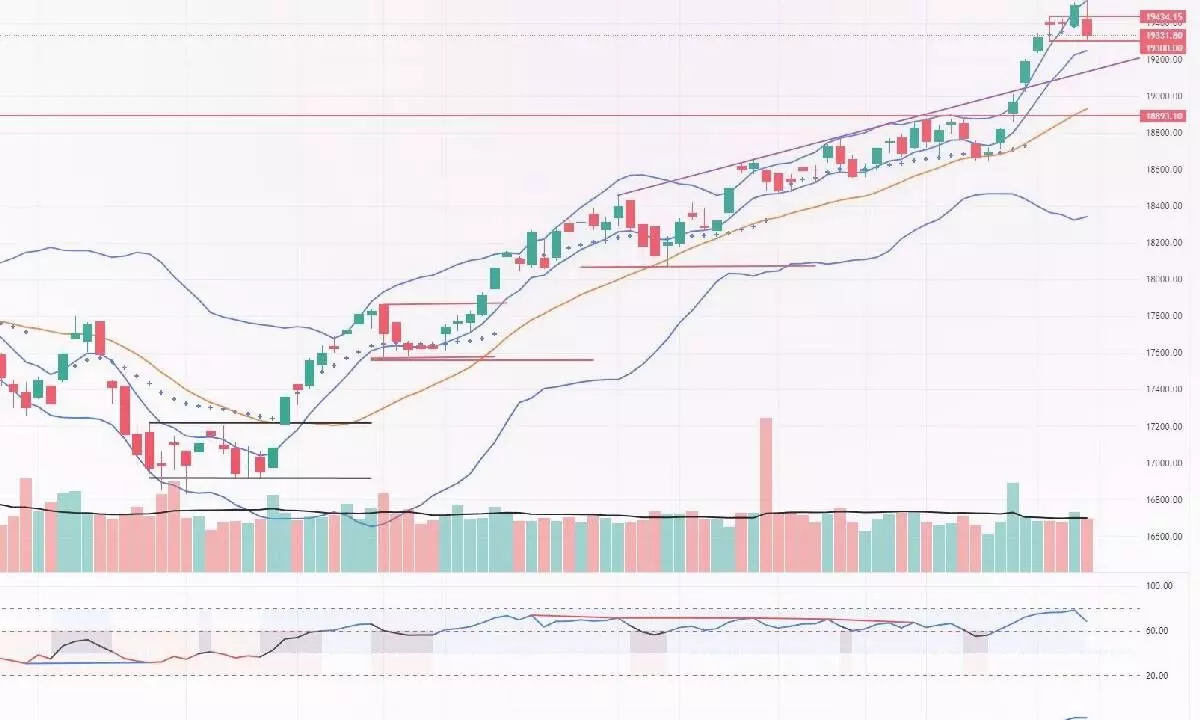
Nifty shows signs of weakness
The index formed a shooting star candle on a weekly chart along with a very strong bearish candle; It also closed below previous 2 days’ low, giving first sign of weakness after a huge rally
image for illustrative purpose

The equities witnessed the profit booking on the weekend. NSE Nifty closed at 19,331.80 points, with 165.50 points or 0.85 per cent decline. Only Nifty Media and Auto indices were positive, as they gained 3.91 per cent and 0.29 per cent respectively. The PSU Bank index also gained 0.98 per cent. The FMCG and Realty indices were the top losers, with 1.53 per cent and 1.18 per cent, respectively. The CPSE index is also lost by 1.36 per cent. All other sectors indices are down by less than one per cent. The market breadth is extremely negative, as the advance-decline ratio is at 0.66. About 128 stocks hit a new 52-week high, and 59 stocks traded in the upper circuit. Olectra, HDFC Bank, and Reliance were the top trading counters on Friday in terms of value. There are 71 bulk deals, and three block deals occurred on Friday.
Nifty has given up more the 50 per cent of the week’s gain. It formed a shooting star candle on a weekly chart. It declined by 193 points from the day’s high and formed a very strong bearish candle. As we have cautioned last week, the Nifty has made a short-term top at 19,523.60 points. From now, unless it moves above this level, we can’tgo for long positions. The volumes were below Thursday’s levels but above the previous three days. After hitting another all-time high, they declined sharply and closed below the previous two days’ low. The index took support at the 23.6 per cent retracement level of the last eight days’ rally. As the index closed below the previous two days’ low, it has given a first sign of weakness.
The RSI declined to below the 70 zone. The MACD line is also flattened. It also closed below the monthly VWAP. On an hourly chart, the index closed in the moving average ribbon and weekly VWAP. These are not good signs at the lifetime high. Friday’s decline in broader market participation is also a sign of distribution. Now, the 19,434-524 zone will act as a strong resistance, and only above this zone, the trend continues. But, a close below the 19,234-200 levels, which is the gap area of last Monday, will be crucial support. Either side of this support and resistance zone will result in a sharp directional move.
The global markets are also cracking down. The DAX has broken down the head and shoulders pattern. And the Dow declined by over a percentage point. In this condition, it is better to have a cautious view of the domestic market.
(The author is Chief Mentor, Indus School of Technical Analysis, Financial Journalist, Technical Analyst, Trainer and Family Fund Manager)

