Nifty may test 20,150 level
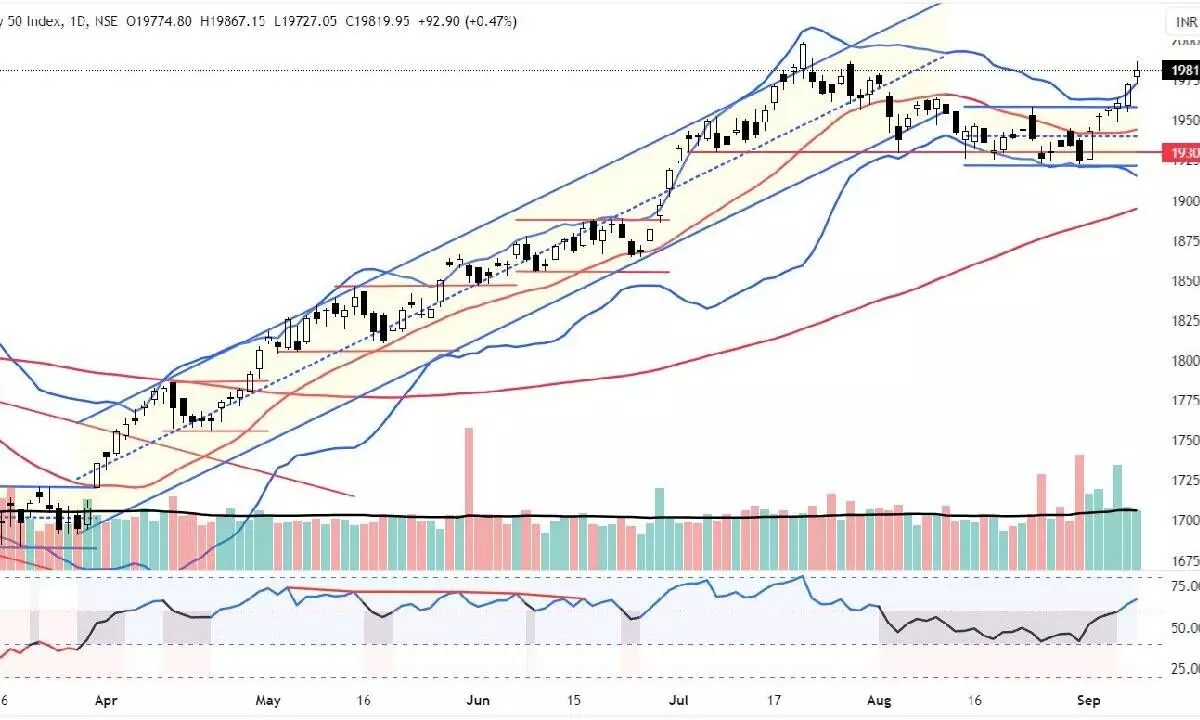
Price pattern analysis shows that benchmark index shifted its range from 19,250-19,500 to 19,585-19,988 points; A breakout above this new range may test the new level in a faster manner
image for illustrative purpose

The markets came out of the range. NSE Nifty closed higher in all five trading sessions last week. After trading in the 434.30 points range, the Nifty gained by 381.95 points or 1.97 per cent. The BSE Sensex gained by 1.85 per cent. The rally in Mid-cap and Small-cap indices gained by 3.88 per cent and 3.44 per cent, respectively, and continued the outperformance. All the sectoral indices closed higher. Nifty Media and Realty were the top gainers, with 5.16 per cent and 4.98 per cent, respectively. The broader market breadth is positive all the weekdays. The FIIs were continuously selling this month. They sold Rs8,8.33.47 crore, and the DIIs bought Rs6,867.07 crore worth of equities.
As mentioned in the previous column, the importance of multiple support at the 19,250 zone resulted in a solid breakout of a 15-day flat base breakout. We also discussed that the tight-range breakouts will result in an impulsive move. Now, the Nifty registered the highest weekly close and the third-highest close on a daily chart. As stated earlier, the Nifty rarely extended the losses beyond five consecutive weeks. The closing has been positive for the last six days. The daily positive closing also rarely extends beyond 8-9 days. So, expect the next 2-3 days of positive bias. The previous high is less than a percentage point away. If the Nifty continues its rally for another 2-3 days, a new lifetime high can be achieved.
Last week’s breakout of a flat base with above-average volume is also a positive aspect of the breakout. Most importantly, the RSI has also shifted its range into the strong bullish, which is an added advantage of the breakout. After a close above the 50DMA, the index changed its direction and moved higher. This enhanced the buying interest among the investors. Now, the index is trading 1.55 per cent above the 50-DMA and 1.94 per cent above the 20DMA. The 20DMA has also entered into an uptrend. The Bollinger bands began to expand. The MACD is above the signal line, and the histogram suggests the bullish momentum is picking up.
Even though the benchmark index is at arm’s length to fresh lifetime, there are concerns. The Volatility remains at a historical low, which is the biggest concern. The India VIX is at a multi-month low of 10.87. The Rupee declined to an all-time low of over Rs83, which also may influence the FII flows. PSU Banks and PSE stocks are rallying to new highs and leading the market. The Midcap-100 and Smallcap-100 indices are at new highs, look overextended the rally, and are in extremely overbought conditions. The Nifty price pattern analysis shows that the index has shifted its range from 19,250-19,500 to 19585-19988. A breakout above this new range may test the 20150 in a faster manner. As long as the recent Flat Base of the middle range of 19400 is protected, be with a positive bias.
There are several sectors have seen improvement in momentum and relative strength. The PSE, IT, and Auto sector stocks are performing relatively better. Among all, the IT index looks promising as the index’s momentum is picking up in the improving quadrant. The Media index is at its peak and may lose some momentum. The stock-specific activity will continue with more focus on Mid and small-cap segments. As the VIX is the lowest level, be vigilant in protecting the profits. It is advised to avoid the short positions.
(The author is Chief Mentor, Indus School of Technical Analysis, Financial Journalist, Technical Analyst, Trainer and Family Fund Manager)

