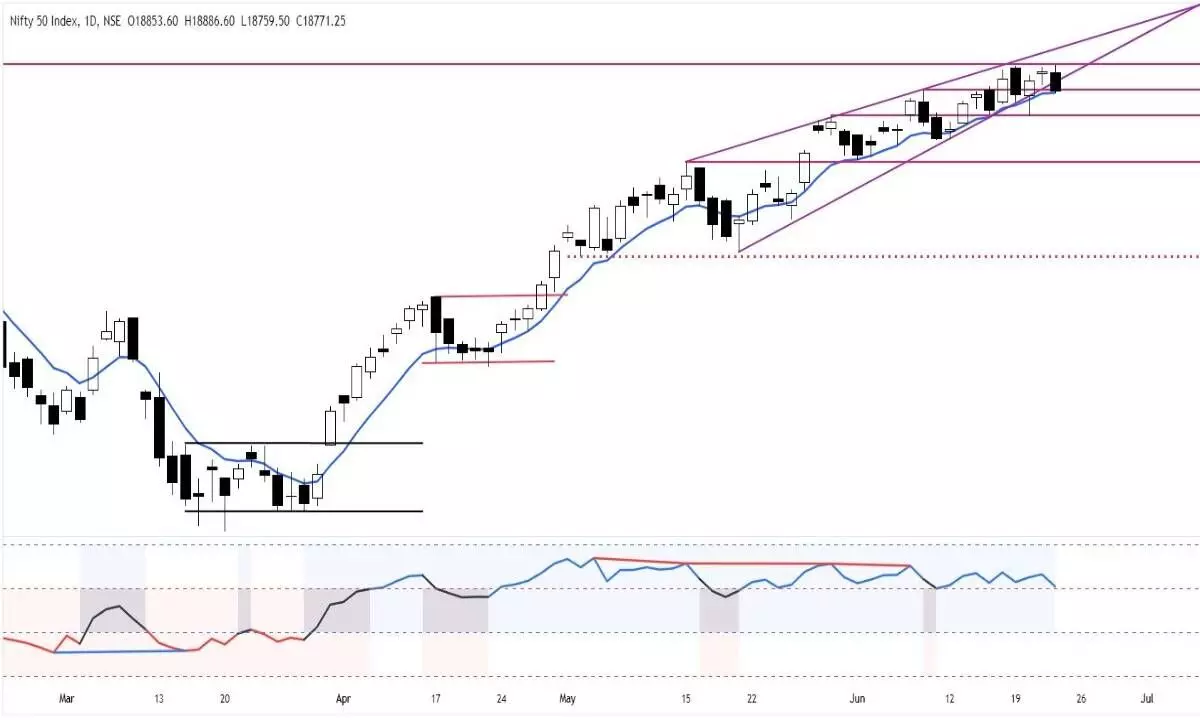
Nifty hints fresh weakness on charts
The index formed a lower, higher high bar, showing increased volatility; negative divergence exists still on RSI nearing breakdown, while MACD histogram gain bearish momentum
image for illustrative purpose

The equity benchmark indices traded volatile and failed for another day to hit a new all-time high. NSE Nifty closed at 18,771.25pts with a decline of 85.60 points or 0.45 per cent. Only Metal and Media indices closed flat to positive. The PSU bank index and Energy indices were the top losers, with 1.67 per cent and 1.04 per cent. The PSE index also declined by 1.12 per cent. All other sectoral indices declined by 0.2 per cent to 0.96 per cent. The market breadth is extremely negative, as the advance-decline ratio is at 0.45. About 91 stocks hit a new 52-week high, and 49 stocks traded in the lower circuit. HDFC Bank, ICICI Bank, and Adani Enterprises were the top trading counters on Thursday in terms of value.
The all-time high was missed on Thursday by just one point. On a roller-coaster day, the Nifty sharply declined from the opening highs. The Nifty has declined by over 110 points from the day’s high. It formed a lower, higher high bar, which is an outside bar, showing increased volatility. Thursday’s decline with higher volume is a distribution day. By closing below the previous day’s low, the index hinted at a fresh weakness. Importantly, the index has broken the rising wedge pattern on a closing basis, which near term bearish. The higher volume in the last four days validates the breakdown. The pattern breakdown target is 398 points, which is near the 18,400-458 zone, which is also another swing low on 1st June. The index is also closed below the previous swing high of 18,777pts. Wednesday’s hanging man candle got the confirmation for its bearish implications on Thursday, as the index closed below the previous day. But, the index took support at the 8EMA and closed above it. But, this crucial short-term average flattened on Thursday.
The negative divergence in RSI still exists and is near the breakdown. The MACD histogram shows the gain in bearish momentum. In any case, the index closes below this 8EMA of 18,761pts, which will give the first bearish signal. The swing low and the 20DMA are at a similar level at 18,660pts. Out of four days, three days this week, the Nifty missed the all-time high by 1-28 points. The bulls are not confident to step into uncharted territory. Now, it has to close above 18,888pts decisively for an uptrend to continue. Stay cautious as long as it trades above the 18,660pts, and be bearish below this level.
(The author is Chief Mentor, Indus School of Technical Analysis, Financial Journalist, Technical Analyst, Trainer and Family Fund Manager)

