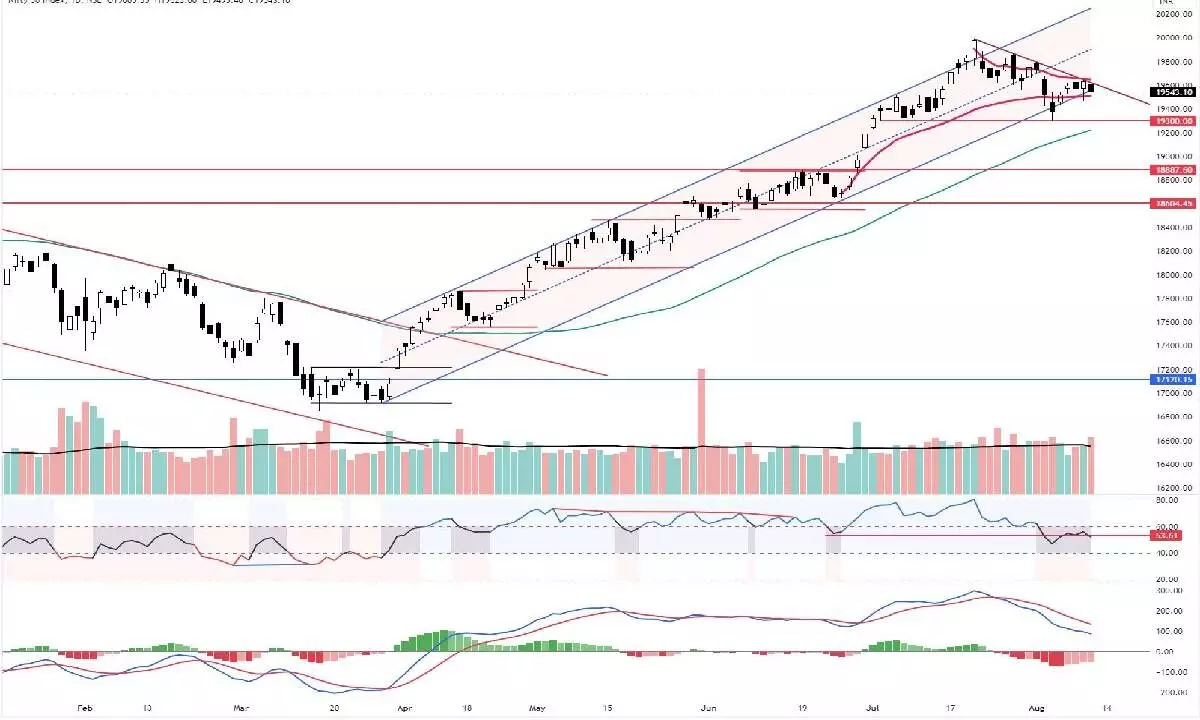
Nifty forms inside bar on charts
The index also formed a lower high candle which is not a good sign
image for illustrative purpose

On a neutral monetary policy, the equities reacted negatively. The benchmark indices closed at their key supports. The NSE Nifty declined by 89.45 points or 0.46 per cent and closed at 19,543.90 points. The Bank Nifty and FinNifty declined by 0.76 per cent each. The Nifty Media index gained by 6.63 per cent. The Nifty Metal Energy indices are up by 0.68 per cent and 0.34 per cent. All other indices registered modest losses. The India VIX is up by 2.33 per cent to 11.40. The volumes were higher, and the market breadth was negative. The Advance-Declined ratio is at 0.78. About 145 stocks hit a new 52-week high, and 71 stocks traded in the upper circuit. Tata Motors, HDFC Bank, ZEEL, and ICICI Bank were the top trading counters on Thursday in terms of value.
The much-expected event, RBI monetary policy, did not influence the price action. The Nifty closed at the rising channel support. They faced resistance at the sloping trend-line. Wednesday’s late surge gains were erased on Thursday. The Nifty registered another distribution day as the volumes were higher than the previous day on a 0.46 per cent decline. In fact, the volumes were higher in the last five days. The index closed at the lowest level in the current week. In the last four trading sessions, it is moving in the last week’s range and forming an inside bar on a weekly chart. It is also formed as an inside bar on the daily chart too. Last week’s range of 19,296-796 is crucial for either side breakout. The index formed a lower high candle is not a good sign. As stated earlier, the mean reversion is completed. The 20DMA is flattened, and the Bollinger bands are contracting now. Now Thursday’s high of 19,624 points and 19,664 points (20DMA) is the strong resistance zone. Only above this zone, the Nifty will be able to resume the upside move towards the previous week’s high of 19,795 points. On the downside, the index may find support at 19,410 levels. Otherwise, it can test the last week’s low of 19,296 points on a sharp slide. Below this level, with additional distribution and a close below 50DMA, means a confirmed downtrend. Currently, it is holding five distribution days. The RSI is down, and the MACD line is declining continuously. The index is taking support at Anchored VWAP. For now, there is very little scope to move above the previous week’s high. Stay on the neutral to bearish view.
(The author is Chief Mentor, Indus School of Technical Analysis, Financial Journalist, Technical Analyst, Trainer and Family Fund Manager)

