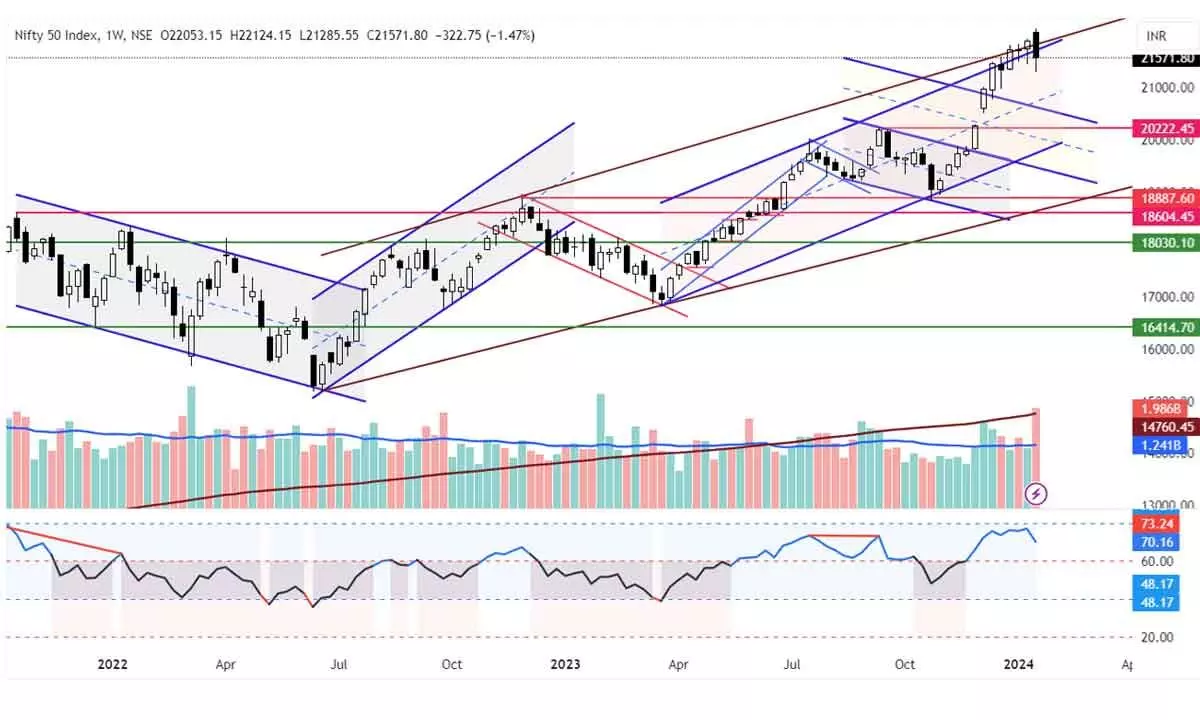
Nifty forms bearish Engulfing candle
After a Doji and Hanging Man candles, the bearish Engulfing candle confirms the reversal; On a daily chart, the index tested the 20DMA and reacted on the downside
image for illustrative purpose

What Charts Say?
l 3 trading sessions this week will further confirm the reversal
l Just 6 trading sessions left this moth
l Nifty clearly given signs of topping
l At least 16 tops formed in Jan month in last 23 yrs
In an extended six-day week, the indices faced a bear attack. NSE Nifty traded in the 838.60 points or 3.94 per cent range and finally settled with 317.60 points or 1.45 per cent decline. The Bank Nifty declined by 1,999.80 points or 4.19 per cent. FinNify was down by 3.56 per cent, and the Metal index declined by 1.76 per cent. The CPSE and PSE indices were the gainers, with 4.29 per cent and 3.36 per cent, respectively. The market breadth is mostly negative. Last week, the FIIs aggressively sold Rs22,972.66 crore worth of equities. The DIIs bought Rs10,712.73 crore.
The Nifty has formed a bearish Engulfing candle on the weekly chart and recorded its highest weekly volume after the last week of May 2023. This is a sign of distribution. The FIIs’ aggressive selling in the past four days also suggests institutional selling. The last week’s price action covered the previous three week’s price action, and the price pattern looks like a megaphone or broadening formation. The week began with a positive gap and formed a new high on January 16 at 22,124.15 points. The index heavyweight HDFC Bank’s negative earning surprise spoiled the market mood, declining sharply by 3.79 per cent from an all-time high in just three days.
After three weeks in January, and just six trading sessions left, the index has clearly given signs of topping. At least 16 tops were formed in January in the last 23 years. Apart from forming a bearish Engulfing candle, the Nifty has reacted from the confluence of channel resistances. Last week’s fall was the biggest in recent history or after October 3rd week. But this fall with higher volume also indicates the serious distribution. After a Doji and Hanging Man candle, the bearish Engulfing candle confirms the reversal. In any case, a negative close next week, which has just three trading sessions, will further confirm the reversal.
On a daily chart, the index tested the 20DMA and reacted on the downside. On Saturday, it formed a bearish Engulfing candle, which is a negative sign. The RSI got the confirmation for its bearish divergence implications by closing below the prior lows. The MACD histogram shows a strong bearish momentum. The trend strength indicator ADX also confirms the reversal, as the -DMI moved above the +DMI, and the ADX line is declining.
The short-covering may lead to a bounce as the monthly expiry is scheduled. In such a case, the index may form an inside bar next week, in most bull case scenarios. To move higher, the index must first close above the 20DMA, or 21,658 points. It has a major resistance at 21,834 points, which is prior to the flat base breakout level. It may be difficult for the index to move above 22,124.15 points and form a new high. On the downside, if the index fails to move above 21,658 points, it may go down below last week’s low and confirm last week’s bearish engulfing implications.
Many sectoral indices lost their momentum and fell into the lagging quadrant in Relative Rotation Graphs. The Bank Nifty, FMCG, FinNifty, Media, and Consumer Durable indices are in the lagging quadrant. The oil and gas, and metal indices were firmly in the leading quadrant. Though the Realty index is in the leading quadrant, it is losing momentum. All other indices are also losing momentum and may fall into the lagging quadrant from a weakening quadrant.
Now, the index holds four distribution days, and any increase will lead to a change in the market status to a downtrend. The 50DMA is just three per cent away. For next week, the index may move in the 21,834-200 broad range. The daily ranges will also increase along with the volatility. So, be vigilant about the positions on either side. The PSU stocks will be in the limelight as the budget is nearing. The earnings are pouring, and the stock-specific activity will continue. Continue to book the profits, and stay on sidelines.
(The author is Chief Mentor, Indus School of Technical Analysis Financial Journalist, Technical Analyst, Trainer, Family Fund Manager)

