Nifty forms bearish Doji candle
There’s a probability of limited trading range as there are only 3 trading sessions this week
image for illustrative purpose

The domestic markets witnessed see-saw moments during the last week. It began with a big bang move with HDFC twins merger news, which ended on a positive note with RBI's neutral policy stance. But it erased all the weekly opening gains in the middle of the week. The Nifty moved in the 514 points range and ended with 113.9 points or a 0.64 per cent gain. The BSE Sensex is up by 0.3 per cent. The broader indices outperformed as the Nifty Midcap-100 and Smallcap-100 indices advanced by 3.6 per cent and 2.7 per cent. On the sectoral front, the Nifty FMCG, Energy and Metal indices were up by over four per cent, and the Nifty IT was the top loser with 2.6 per cent. Overall, market breadth is mixed. FIIs sold Rs.4,427.75 crore, and DIIs bought 3,977.75 crores in the last six trading sessions. India VIX declined by 4.05 per cent and closed at 17.69, a 12 week low.
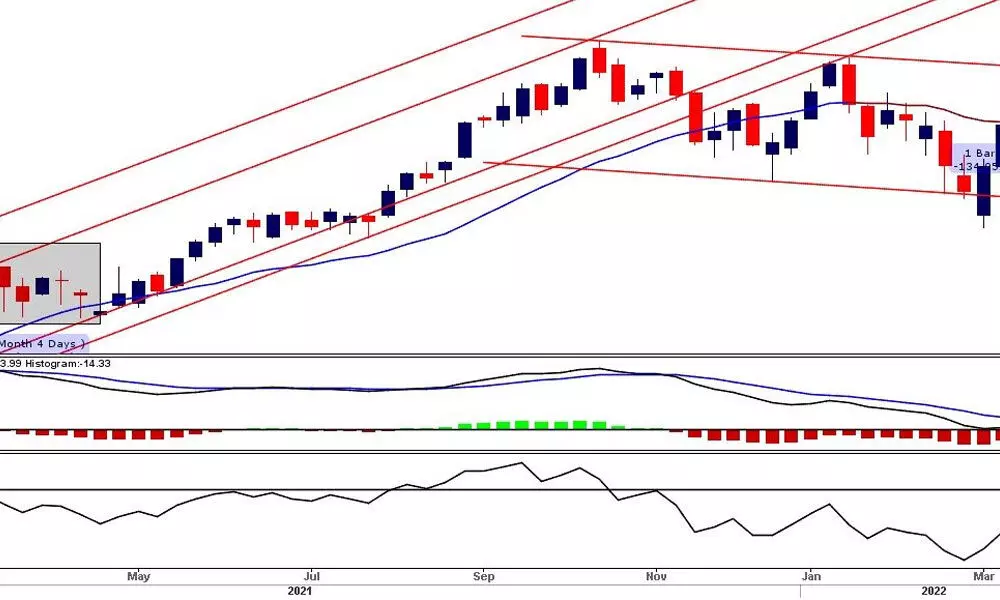
On Monday, the benchmarks and the broader market began the journey with a big move with the heavyweight stocks HDFC and HDFC Bank merger news. This euphoric move's gains were erased in the next three days within no time. With this, the Nifty has formed a long-legged Doji on a weekly chart. It failed to get the follow-through days and move above the channel resistance. In any case, the Nifty fails to cross 18115 decisively with a volume, and we can assume that the Nifty has formed another swing high. There is primary evidence for this assumption.
Earlier, when the Nifty formed a lifetime high in 18604, it formed a dark cloud cover candle and fell. Later in January's second week, it formed a big bearish candle with over a four per cent decline in a week. These are the previous swing highs with bearish candles. In the previous week, it also formed another bearish Doji candle. Steve Nison's Doji rule says, a Doji at a swing high is a sell signal. As there are only three trading sessions next week, there is a probability of trading range will be limited to the previous week. Even in this case, if the failure to surpass the resistance line will be negative only.
The pattern analysis shows that the Nifty has broken the rising wedge on Thursday, which is bearish. The momentum has been clearly waning for the past four days. The 50 and 200 DMAs are moving parallel. This is a unique situation in current market conditions. Suppose the 50DMA moves below the 200DMA will be a longer term bearish sign. The RSI is below 60, and does not show any divergences. The weekly MACD is bearish and below the signal line. However, the narrowing slope of the histogram suggests that the indicator may show a positive crossover in the coming days. The parabolic line shows a 17915 level is immediate resistance. The flattening ADX shows a weakening trend. As mentioned last week, the distance between 20DMA and the index declined. This shows that the intermediate peak is at 18115. The True Strength Indicator (TSI) is also showing the market made is peak.
As several evidence shows, the benchmark index is almost at an intermediate peak and near the strong resistance zone. Only surpassing the 18115 will result in a channel breakout. The previous swing is at 18350, and a move above this level, the Nifty will form a new swing high. This is a true trend reversal for the market, and we see a new lifetime high. Till then, the 18350 and 17600 zone will be neutral zone. Within this zone stock, specific actions will be seen. The index may oscillate within this zone for at least the next two to three weeks.
Even the derivative data suggests the 17800-18000 level is important for the market. Either side breakout is a remote chance. At the same time, there is very little chance of a downside move. The Nifty is likely to continue to consolidate in the previous week's range. The Q4 and FY22 results will pour in from the next week. The IT packs results will dominate the market direction. As the market is not expecting surprises this quarter, it may be a muted performance from the IT and other sectors. As long as it trades in the previous week's range, apply neutral strategies on indices. Below 17600, we may see an intensified profit booking.
Week ahead
• IT packs results to dominate the mkt direction
• Only three trading sessions next week
• Mkt to oscillate within 18350 and 17600 for nxt 2 to 3 weeks
(The author is Chief Mentor, Indus School of Technical Analysis, Financial Journalist, Technical Analyst, Trainer and Family Fund Manager)

