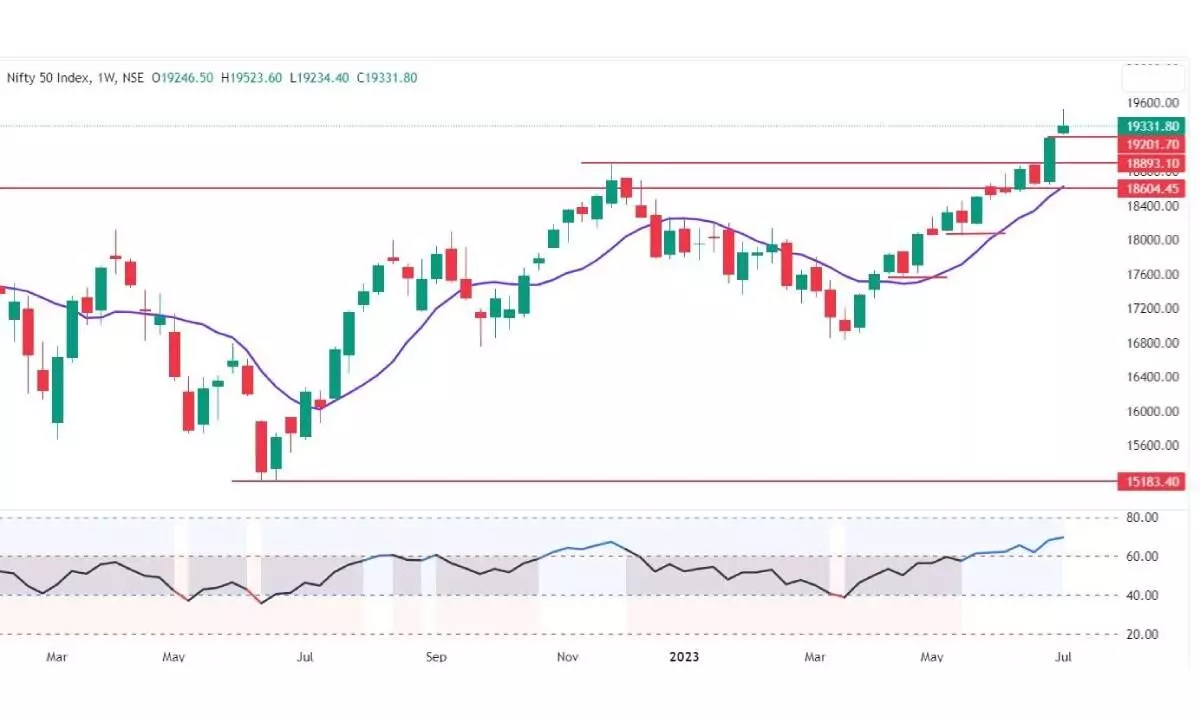
Nifty charts signal range-bound movement
The index has formed an outside bar and a Shooting Star candle, along with several exhaustion signs which could lead to trend reversal
image for illustrative purpose

Equities continued the bull run for the second successive week. The Benchmark index, NSE Nifty, was up by 142.75 points or 0.74 per cent last week. The BSE Sensex also gained by 0.9 per cent. The Midcap-100 and Smallcap-100 indices outperformed by 3.8 per cent and 2.6 per cent, respectively. The PSU Bank index and Media indices were the top gainers, with 8.5 per cent and 8.7 per cent, respectively. All other sectoral indices also closed with decent gains. The advance-decline ratio is mostly positive during the week. The FIIs bought Rs91,640.85 crore, and the DIIs sold Rs6,878.18 crore worth of equities last week.
The Nifty has finally ended its eight days of winning streak and closed negative on the weekend. It has given up 50 per cent of the week’s gains and formed a shooting star candle. This kind of price pattern, at an all-time high, indicates a potential pause in the trend, and if the profit booking is more intense, it could lead to a reversal. As long as this candle high is not taken out, we can assume that the 19,524pts is a short top. If the Nifty closes below the 19,200pts and fills the gap, the shooting star candle gets the confirmation for its bearish implications.
As we suspected earlier, the over-extension of a rally finally back into the Bollinger bands. The 220 points decline from the all-time high on the weekend signals many outcomes. The index reacted to the rising channel resistance after registering a failed rising wedge pattern breakdown. Thursday’s strong bullish candle, which led to a fresh breakout of an inside bar, has failed as the index closed below the two-day low. There are no bearish signals have emerged yet, but several exhaustion signs are available. On a daily chart, the Nifty has formed an outside bar and a shooting star candle, which is again a warning signal to the bulls.
The RSI and MACD don’t show any divergences. The earlier negative divergences were negated last week as the index rallied sharply. Interestingly, the Nifty’s Relative Strength has not improved even after a series of new all-time highs. The Mansfield Relative Strength indicator is still below the zero line. The Relative Strength line is still below 100 on the RRG chart. This underperformance is because there are not many leading sectors, and it is highly stock-specific. All the major sectors like Pharma, Bank Nifty, FinNifty, and IT sector indices are in the lagging quadrant. Last week, the PSU Bank index contributed most of the gains. Auto and Consumer Durable sectors are losing momentum. Because of the stock-specific activity, we need to be very selective. It is wise to protect the profits on the table with strict risk management principles. The market may enter into a consolidation for some time before taking a direction. We see range-bound movement in the index. The immediate support is at Rs19,247-188 levels. Below this, the major support is at 20DMA of 18,981pts. We may project more than this for next week. Stay cautious about the index and be stock-specific for a short-term trade.
(The author is Chief Mentor, Indus School of Technical Analysis, Financial Journalist, Technical Analyst, Trainer and Family Fund Manager)

