Nifty at new lifetime high, forms an evening star on a daily time frame
image for illustrative purpose

The Indian stock market closed at record high on last Friday. The benchmark index, NSE Nifty, closed all the trading sessions in green territory. It gained 260.35 points or 1.72 per cent during the last week. The BSE Sensex up by 1.8 per cent. The broader index Nifty-500 also closed at a lifetime high with 1.55 per cent gain last week. The Nifty midcap-100 and smallcap-100 indices advanced by 1.1 per cent and 1.8 per cent respectively. On the sectoral front, the Nifty Media is in the top gainer with 7.1 per cent and followed by the PSU Bank index with 4.1 per cent and Realty with 3.4 per cent. NIfty Metal declined by 0.9 per cent and Pharma down by 0.4 per cent. Overall, barring Friday, the market breadth is positive. The FIIs sold Rs 8,427.73 crore, and DIIs bought Rs1,887.45 crore worth of equities during this month. The India VIX is down to 8.8 per cent last and settled at 17.4.
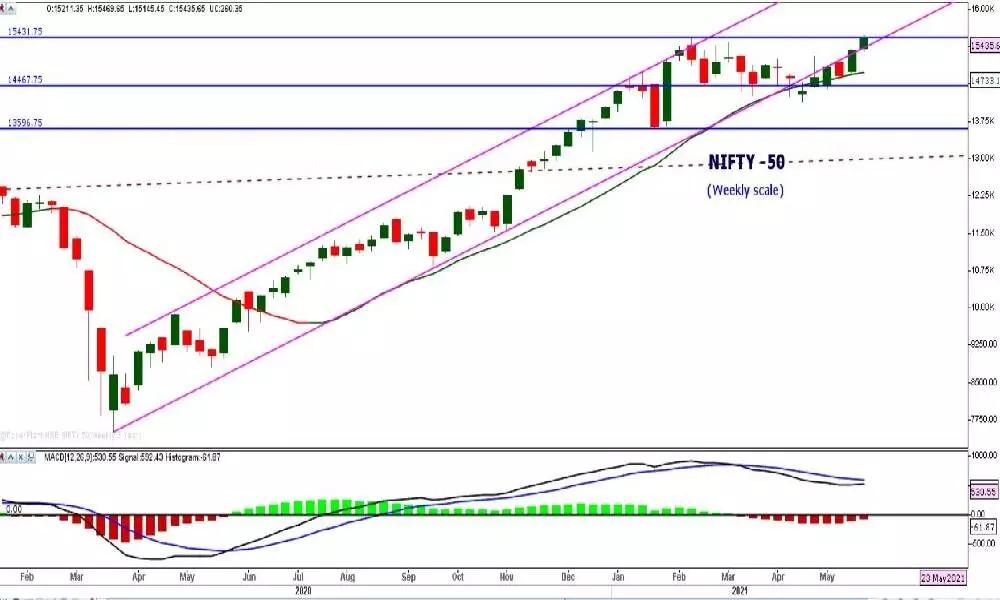
The NSE Nifty closed at a new lifetime high and formed an evening star on a daily time frame. On the weekly chart, it formed a 14-week cup pattern with a 7.73 per cent depth. As per the classical technical analysis, the cup is a very strong bullish pattern. The cup target is almost at 16500. A good consolidation on a lower volume is a pattern character. The breakout is also valid as the volume recording above average for the past two weeks. Now, the question arises as it formed an evening star with a gap up; because of this, the Nifty will also form a handle? Or just Cup? Both of them will ultimately touch the new high eventually.
In any case, a gap down, opening on Monday, and closes below the 15,390 will lead to handle formation. Generally, the Handle will end at the 38.2 to 50 per cent retracement of the prior uptrend. In a very bull case scenario, the handle formation will end at a 23.6 per cent retracement level. The 38.2 per cent retracement level of the prior uptrend is currently at 14,966, and to 50 retracement level is at 14810. A bounce from this will touch 16223, which is a 161.8 per cent retracement of recent consolidation.
The Fibonacci extension is showing that the 100 per cent retracement is at 15986. So, in the bull case scenario, the Nifty may scale to 15986, 16223, 16500 levels in the near future. These levels may act as resistance too.
But, in a bear case scenario, the first thing a cup will be followed by a handle in the majority of the times. In such a case, the Nifty may enter counter-trend consolidation, which has a downside target of 15158, 14966 and 14810. These immediate support level on the downside. The Handle may form in two weeks maximum. The highest probability of this Handle may in the form of a Flag. Don't be scary, the Flag forms in lesser time, which means a sharp decline. As long as the Nifty trades between 14810-15430 levels, be with a neutral on the Index, and selectively positive on the stocks.
On the bull case scenario, the Nifty may reach the upside targets of about 34 if the cup breakout continues without handle formation. If the Handle or flag ends at 38.2 retracement level (14966), it may take about 55 trading sessions from the Handle bottom.
There is no point in discussing the indicators. When the market is at a lifetime high, all the indicators/oscillators shows bullishness. There are no negative divergences currently on more extended time frames. Let us ignore the indicators for the week.
A note of caution
A lull before the storm is nature's law. The India VIX is at the lowest level in recent times. Generally, the longer, the lower volatility, indicate the higher volatility will be followed. The prolonged low VIX between 11 - 19 during May 2019 to Feb 2021 resulted in massive volatile days in March 2021. The periods of low volatility indicate complacency of the market participants and often lead to the marking of a potential top. The inverse relationship between the Index and the VIX is an established one. Still, very low levels of the VIX at the time of any attempted breakout, which is yet to occur, bring the sustainability of such breakouts in question when they happen.
(The author is financial journalist, technical analyst, family fund manager)

