Mkts awaiting decisive breakout
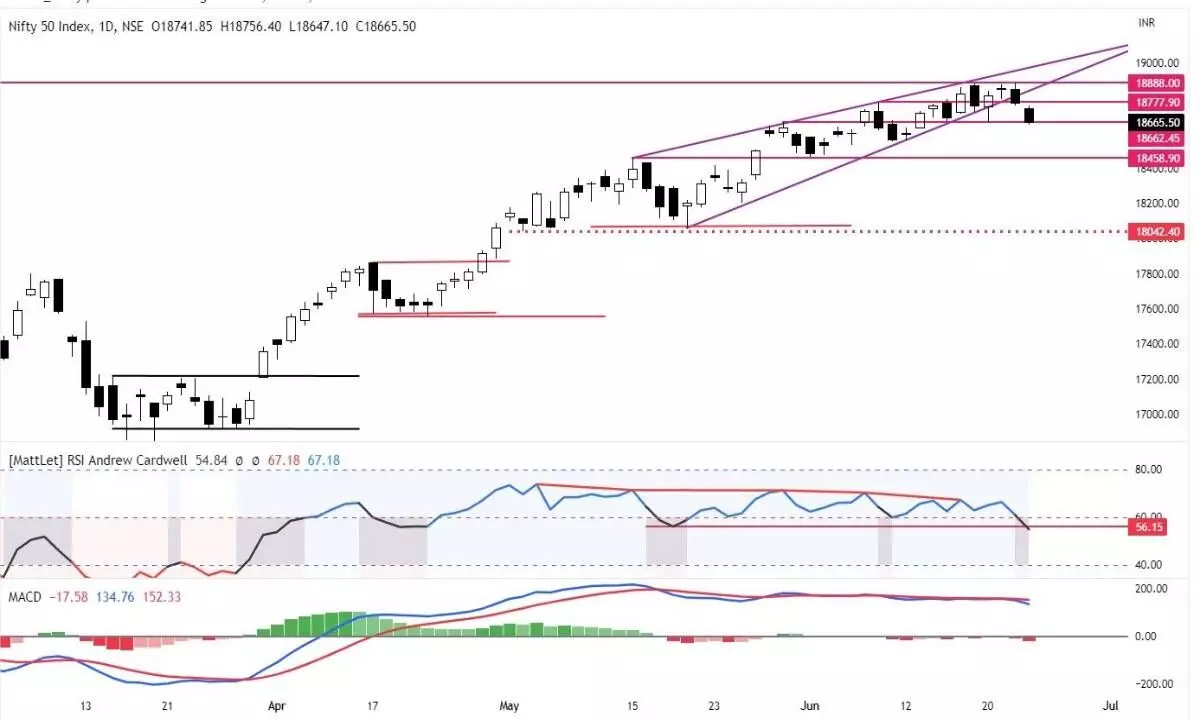
Daily RSI shifted its range to a neutral zone, daily MACD is also declined much below the signal line, showing an increased bearish momentum; During current uptrend, the index closed below 20DMA for the first time
image for illustrative purpose

After advancing for four consecutive weeks, the benchmark index NSE Nifty took a breather this week. It lost by 160.50 points or 0.85 per cent. Though the Nifty failed to hit a new lifetime high by just one point, BSE Sensex hit a new all-time high. But, at the end of the week, it lost by 0.64 per cent last week. The Smallcap-100 index outperformed by a 1.47 gain. The Midcap-100 index declined by 0.98 per cent. Only the FinNifty gained by 0.3 per cent, and all the sectoral indices closed lower during the week. The Nifty Media and Metal indices were the top losers, with 3.6 per cent and 3.1 per cent, respectively. Except on Wednesday, the FIIs were sellers of equity. But, during this month, the FIIs bought Rs6,888.26 crore, and DIIs bought Rs6,022.83 crore worth of equities.
The Dalal Street’s benchmark index BSE Sensex hit a new high last week. The other frontline index Nifty-50 missed it by just one point. The much-awaited all-time high has been realised. After reaching new heights, the indices declined and formed bearish patterns on a weekly time frame. These patterns were similar to the previous historical all-time highs. The Nifty has formed a dark cloud cover candle on the weekly chart. During the October 2021, and December 2022 highs, it also formed similar patterns. The Nifty declined by 18.40 per cent and 10.9 per cent, respectively. Before coming to a conclusion of a reversal, we should know that all the patterns must get a confirmation for their implications. The price must not move above the bearish candle. In other words, the Nifty should not move above 18,887 at any cost.
In the bull case scenario, if the Nifty moves above 18,887pts, as we mentioned earlier, the targets are placed at 19,118pts and 19,455pts. To achieve these short-term targets, the Nifty should not decline below the previous week’s low of 18,647pts. This 230 points range is very crucial for the market direction on the upside. Because several bearish candlestick patterns have failed in recent times, we must wait for confirmation of the current bearish pattern.
On a daily chart, the Nifty broke below the recent minor low and closed below the 20DMA, which is negative in the last week. It also registered a rising wedge pattern, decisively with higher volumes and distribution days. It also registered a failed breakout of a flat base. Before this, the index formed five bases in the rally from 29 March. In the last 57 trading sessions, the index is up by 1,973 points or 11.66 per cent, which is almost equal to the previous decline. This is 100 per cent retracement in less time. The last downswing was in 81 sessions. During the current uptrend, the index closed below the 20DMA for the first time. Most of the declines were limited to 2 or 3 days, but they were with long bear candles. On the upside, there are many indecisive candles formed. Most of the upside moves were with low volumes, and the declines were with higher volumes. This is the reason the current rally is not giving the confidence to go for aggressive long positions.
The index forgot to honour many historical patterns. The VIX continues to be at historical lows. The index forgot the inverse relationship with the VIX. At the lower levels of VIX, profit booking and distribution phases are common. The 87-week consolidation is with low volume. A spurt in VIX, along with volume, will increase the probability of a sharp decline. VIX, at historical lows, indicates that the upside possibilities are limited. Even if it goes up, sustaining at higher levels will be in doubt. The low volume also indicates lesser participation by traders. The market breadth also needs to be improved. The heavyweight sectors like Banks, financials, and IT are relatively underperforming. Unless a significant increase in volume and outperformance of leading sectors will increase the possibility of Nifty reaching new highs, and for this, the VIX must be stable at the current levels.
On the indicators front, the daily RSI shifted its range to a neutral zone from a strong bullish zone. It gets the confirmation for bearish divergence by closing below the previous swing lows. Even on the weekly chart, this leading indicator shows signs of weakening. The daily MACD is also declined much below the signal line, showing an increased bearish momentum. As we mentioned last time, the Commodity Channel Index (CCI), which indicates the market’s short and long-term cycles, showed the intermediate top much earlier, two weeks ago.
We can initiate fresh purchases if Nifty achieves a decisive breakout with higher volume. Otherwise, wait for the market behaviour between 20 and 50DMAs. Be neutral in this range. As the indicators turn negative, it may be wise to be cautious. Wait for a close below 50 DMA for a bearish view.
(The author is Chief Mentor, Indus School of Technical Analysis, Financial Journalist, Technical Analyst, Trainer and Family Fund Manager)

