MACD Signals Increased Bearish Bias
Currently, the price structure is not in the buy zone, and it is not a time to build the port-folio
MACD Signals Increased Bearish Bias

The selling pressure was visible across the board on a weekly derivatives expiry day. NSE Nifty declined by 162.45 points or 0.69 per cent and closed at 23,526.50 points. Only FMCG and Consumer Durables indices closed positive with 0.93 per cent and 0.05 per cent, respectively. All other indices were negative. The Realty index is down by 2.73 per cent, followed by Energy index 2.03 per cent, are the top losers. The Oil and Gas, PSE, and CPSE indices declined by over 1.5 per cent. All other indices weakened further. The India VIX is up by 1.33 per cent to 14.66. The market breadth is negative as 2037 declines and 766 advances. About 95 stocks hit a new 52-week low, and 106 stocks traded in the lower circuit. HDFC Bank, SRF, Reliance, Tata Motors, and Navin Fluoride were the top trading counters, in terms of value.
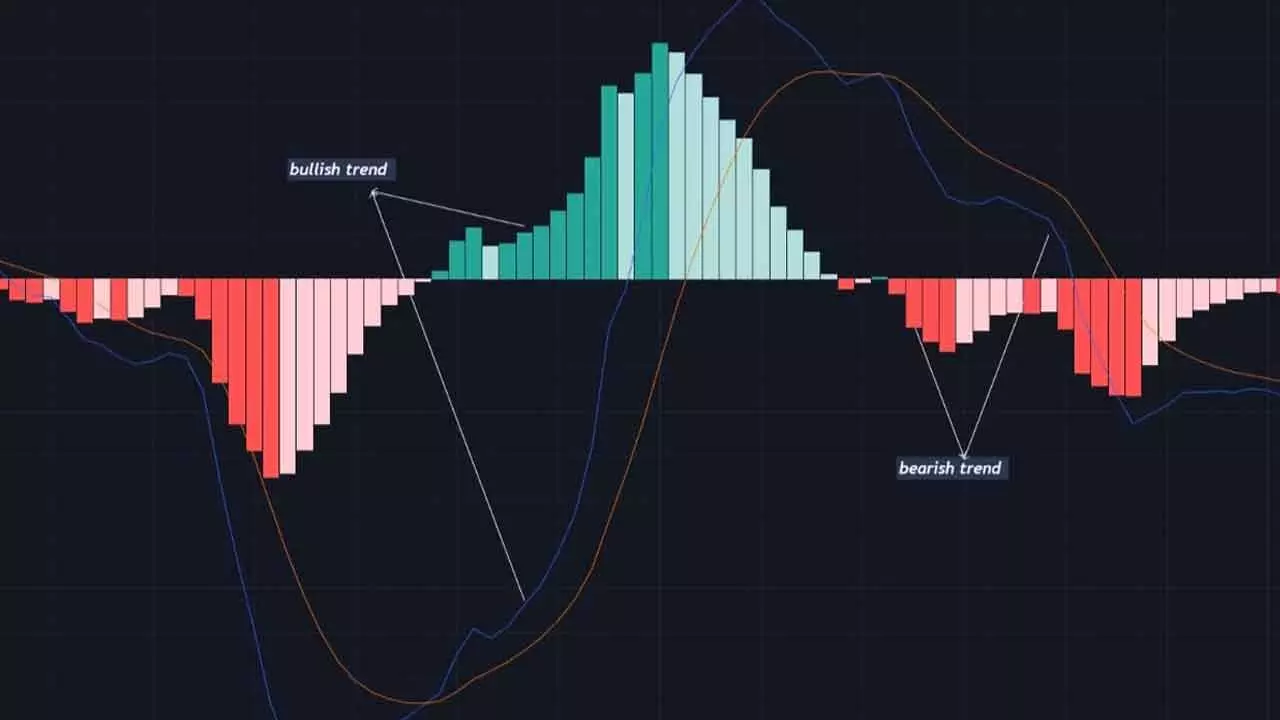
The Nifty weakened further with the broadening of selling pressure. The HDFC Bank has de-clined sharply over the last five days, and it fell by over 11 per cent from its recent high. It con-tributed 49 points to the Nifty fall today. The benchmark index closed decisively below the 50-week average after taking support for the last 8 weeks. Now, the index is below all long-term averages. On a weekly chart, it formed a bearish engulfing candle. The RSI enters the bearish zone again. The MACD is showing an increased bearish momentum. The weekly MACD is just on the zero-line support. The index almost tested the previous day’s low. It formed an inside bar. The rising trend line acted as support for the fourth time. In any case, if it closes below 23500, it will register a breakdown.
The nifty registered a distribution day as the volumes were higher than the previous day on a 0.69 per cent decline. The Nifty is trading below the 38.2 per cent extension level of the prior swings. In any case, the index closes below 23496 on a weekly basis; the next supports are at 23350 and 23263. A close below 23263 is nothing but a new major low. Below this key sup-port, the index will test the 22994, which may act as a strong support. As the earnings season and the general budget is nearing, the market may trade nervous. Any disappointment will result in a strong downtrend. The current pattern target is 21843, which may be tested sooner or later. In the worst-case scenario, the index can test the 4th June low of 21281. Currently, the price structure is not in the buy zone, and it is not a time to build the portfolio.
(The author is partner, Wealocity Analytics, Sebi-registered research analyst, chief mentor, Indus School of Technical Analysis, financial journalist, technical analyst and trainer)

