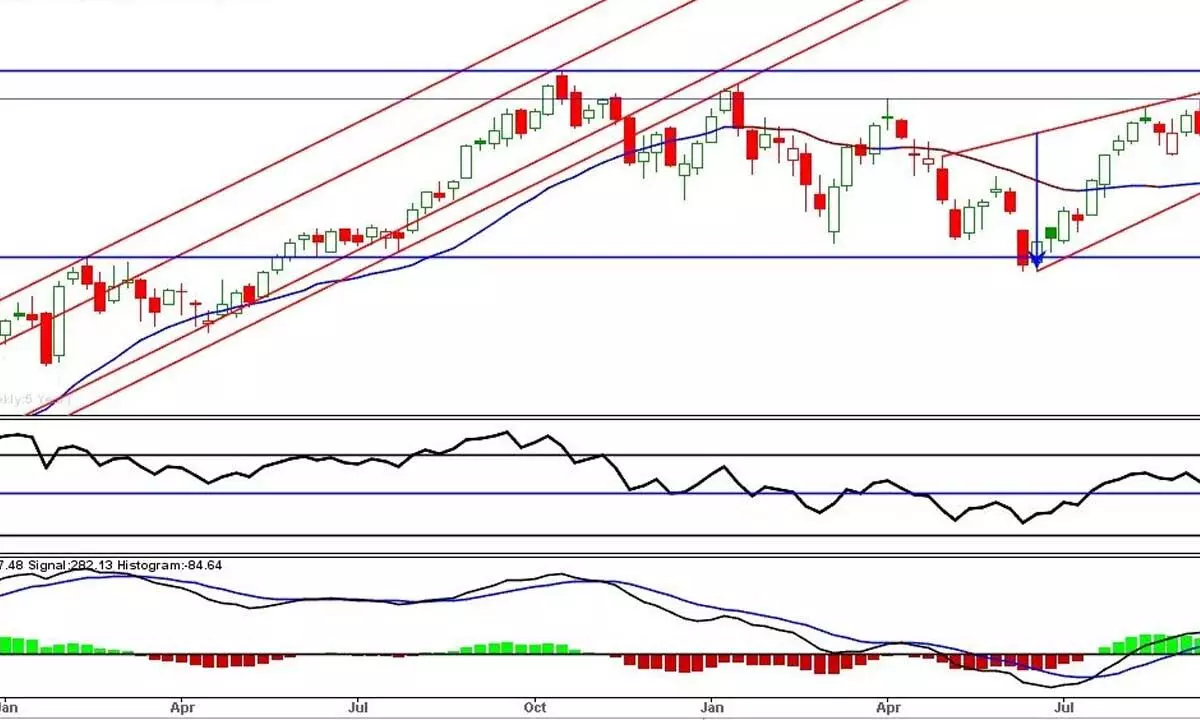
MACD showing fresh sell signal
The RSI (35.32) entered into a strong bearish zone; Any retracement towards 50 may attract fresh selling pressure; Nifty suffered one of largest declines after Dec 3rd week as the benchmark index broke the 17761 support
image for illustrative purpose

The HendenHindenburg research report on Adani Group companies rattled the market last week.NSE Nifty has traded in a wide range of 707.70 points and finally settled with 42,330 points of 2.35 per cent decline. It is one largest declines after December third week. BSE Sensex also declined by 2.1 per cent. The broader market indices, Nifty Midcap-100 and Smallcap-100 down by 2.8 per cent and 3.4 per cent, respectively. Nifty Auto is the top gainer with 3.1 per cent. The FMCG and IT indices are up by 1.3 per cent and 0.8 per cent.
The banking indices sharply lowered by 4.6 per cent to 9.7 per cent. Nifty Energy is down by 75 per cent. Overall, market breadth was extremely negative last week. The FIIs sold aggressively in the last two days, and Friday, they sold Rs5,977.86 crore, which is the highest single-day exit. In January, they sold Rs29,232.29 crore, and the DIIs bought Rs23.392.91 crore.
The benchmark index finally broke the 17761 support decisively. Importantly, the breakdown is very sharp as the prior price action is indecisive for a long period. This sharp move was also what we expected in the previous columns. It also broke the 100DMA support and held on to 150DMA support. The week began with a Doji candle and formed a bearish engulfing candle on Tuesday and formed a lower high within the range. This bearish candle pattern demonstrated its serious implications. Thursday and Friday decline with extremely negative market breadth, indicating the blurred future.
The last month's bearish engulfing candle is about to get a confirmation in the next two days. Only if the Nifty closes above 18106 will it negate the Bearish Engulfing's the negative implication. For that, the Nifty has to rally more than 500 points in the next two days, which is remotely possible. As mentioned, on a monthly chart, the RSI (58.74) has developed a serious negative divergence. If the monthly RSI closes below 55, we will get long-term bearish signals. On the weekly chart, a series of inside bar actions ended with the confirmed breakdown. It also closed 1.63 per cent below the 20-week moving average. The weekly RSI closed below the prior lows and confirmed the breakdown. After the rising wedge breakdown during December, the index moved in sideways for four weeks. In the latest breakdown, the Nifty has tested the 38.2 per cent retracement level of the June-November rally. In any case, Nifty falls below 17472, which gives further confirmation for bearish outcomes.
The broader index, Nifty-500, also broke the prior low support. The Nifty Midcap-100 and Smallcap-100 indices were closed near the prior lows. A breakdown results in a strong bearish grip. The Bank Nifty closed below the 20-weekly average. As the highest weightage indices fell the most, the market is lagging in leading sectors.
On a daily chart, the MACD has given a fresh sell signal. The RSI (35.32) entered into a strong bearish zone. Any retracement towards 50 may attract fresh selling pressure. In all time frames, the broader market turned negative. The volatility also surged 18.1 per cent on Friday. As Union Budget is just two days away, the volatility will increase further. We need to watch the market's reaction to the Hindenburg report and the Budget proposals. The Nifty IT, Auto, and Pharma sectors are looking better than other sectors. It is time to be highly cautious due to event risks. If possible, all the emotional persons keep away from the markets.
(The author is Chief Mentor, Indus School of Technical Analysis, Financial Journalist, Technical Analyst, Trainer and Family Fund Manager)

