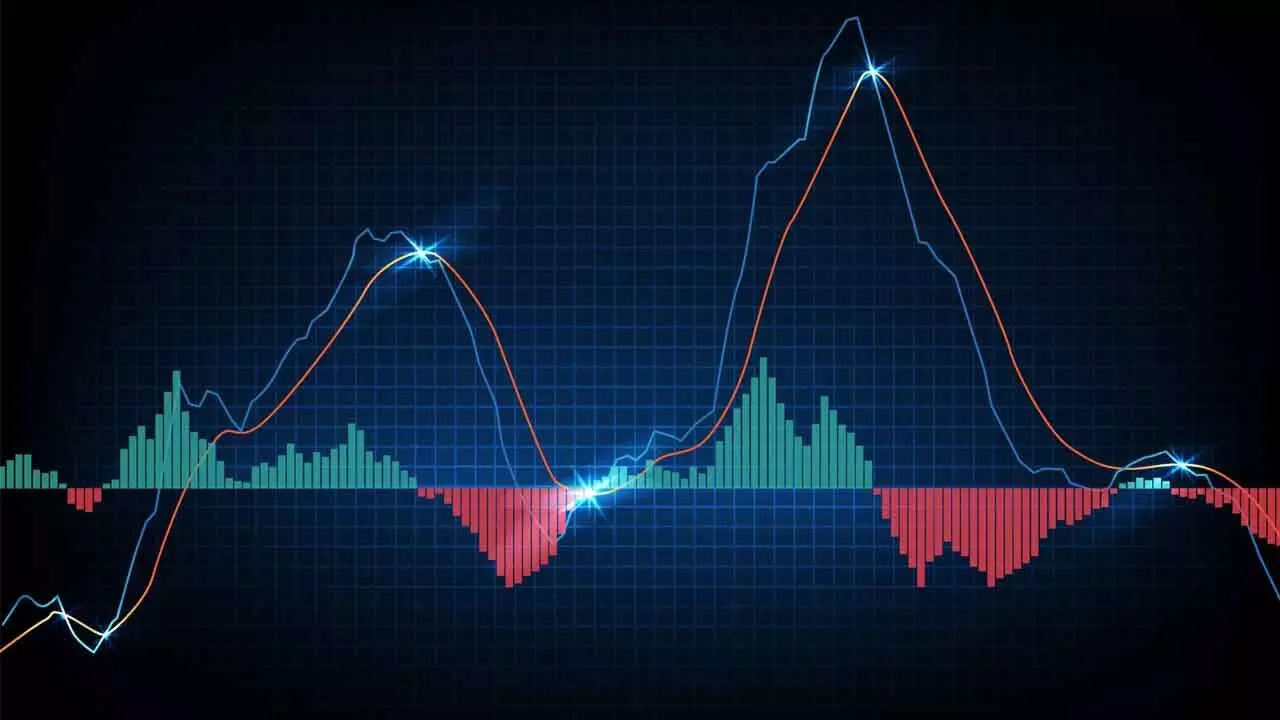
MACD line forms bearish divergence
The daily RSI has formed a bearish divergence; Major indicators declined, while prices made new highs
MACD line forms bearish divergence

Positive Market Breadth:
♦ MIndia VIX is up by 16.92%
♦ Bollinger bands are expanding
♦ Nifty 6.61% above 20-week avg
♦ Counter-trend consolidation likely
The benchmark index NSE Nifty snapped an eight-week winning streak as Nifty declined by 117.15 points or 0.47 per cent for the last week. BSE Sensex also declined by 0.43 per cent. The Nifty Midcap index is up by 0.25 per cent, and the Smallcap index is down by 0.28 per cent. The Nifty Energy index is the top gainer with 2.53 per cent, and Pharma is up by 1.39 per cent. The Realty index is down by 3.76 per cent, and the IT index declined by 3.04 per cent. The market breadth is mostly positive. The India VIX is up by 16.92 per cent to 14.32. The FIIs bought Rs5,407.83 crore and the DIIs bought Rs23,486.02 Crore in July month.
The Nifty finally ended its unabated eight-week rally influenced by the global market. On Friday, the index fell by 1.17 per cent, with a big gap-down opening. As we warned, the index closed below the 8EMA support and proved that the No impulse will continue forever and has to enter into a counter-trend. Interestingly, the swing was 8 weeks old, which is a Fibonacci number. The Nifty closed at the week’s low, which gave a weaker signal. But it is still much above the 10-week average. It is trading 3.68 per cent above the 50DMA and 0.53 per cent above the 20DMA, which is at 24,588 points. The rising channel’s support is also at a similar level. Before the big decline, the index had formed new highs with indecisive candles and the daily ranges were shrunk.
As stated earlier, the index showed an overstretched condition and was vulnerable to mean reversion. If the price moves too far from the mean, it must come to the mean level. Currently, the index is trading 6.61 per cent above the 20-week average, and the Bollinger bands are expanding. Out of eight weeks of the rally, in six weeks, the index closed above the upper band, which is an indication of overextension. Currently, the index is 1,531 points above the 20-week average. The impulsive move is because the index oscillated around the 20-week average for 18 weeks. Any prolonged congestion will lead to a sharp move. Before the 19 weeks of range-bound activity, the index had experienced an upside-sharp move for 9 weeks. In fact, the index has met the 100 per cent Fibonacci extension target of the prior swing.
After 2016-2020, the Nifty has formed a rising wedge pattern, which is 53-weeks long. The earlier rising wedge was 61 weeks old and formed two bearish divergences in the monthly RSI. The result of these two divergences was the Covid crash. The current rising wedge holds one bearish divergence. But there are several negative divergences in weekly and daily charts. As the index is reacting from the rising wedge resistance line, it is time to stay cautious. At the same time, the two-cycle of corrections is due. Expecting a reasonable correction sooner or later. Our target of 25,056 was already met last week. But the corrections may be a sharper one. The previous week’s low of 24,074 is important support for now. The 10-week average is at 23,970 points. If the index is able to protect this support zone, be cautiously optimistic. A close below 23,970 will be negative and can test 23,186, which is the 20-week average and the 23.6 per cent retracement level of the prior rise.
The Monthly RSI was tested in the above 80 zone, which was extreme. Whenever it reaches above 80, the market corrected significantly in the past. The daily RSI has formed a bearish divergence. Even the MACD line also formed the bearish divergence. These major indicators declined, while prices made new highs.
The Nifty may start the new week on a weak note. Keep the 20DMA of 24,588 as a strict stop loss for existing long positions. As the earnings season continues, focus on stocks declaring 25 per cent EPS growth. As counter-trend consolidation is expected, stay with high relative strength stocks. For fresh purchases, focus on stocks improving their relative strength. Be vigilant and protecting the capital and profit should be the primary moto now.
The RRG charts show that the Nifty IT and FMCG indices are approaching the leading quadrant with improved relative strength and momentum. Though the Consumer Durables index is in the leading quadrant, it is losing momentum. The Metal, Auto, and Realty indices declined into the weakening quadrant and lost momentum. Out of all, the Pharma sector is very strong.
(The author is Chief Mentor, Indus School of Technical Analysis, Financial Journalist, Technical Analyst, Trainer and Family Fund Manager)

