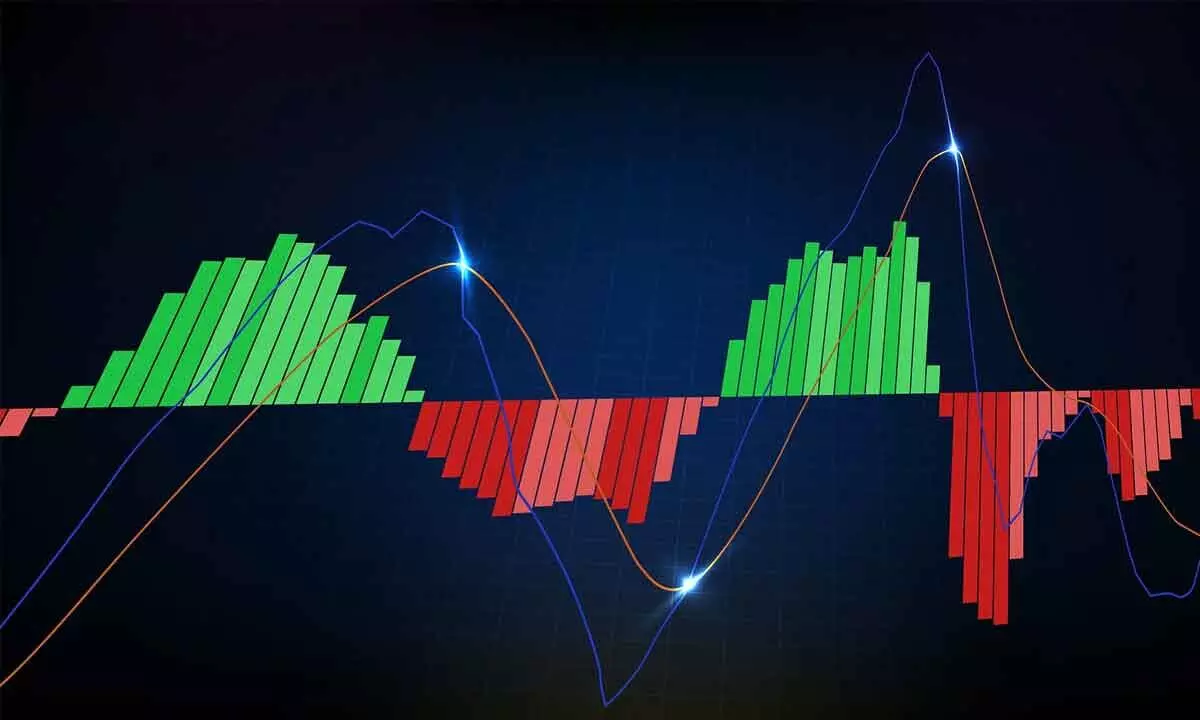
MACD indicates bearish momentum
Now, a move above Wednesday’s high of 22,825 is positive; As long as it is below this level, be with a bearish view
image for illustrative purpose

Nifty continued its downside move with more profit bookings before the monthly expiry. It closed below the prior parallel highs. It closed below the crucial supports 5 EMA and 8 EMA. The volumes were higher than the previous day. The index declined by 425 pts or 1.84% from Mon’s all-time high
The equities declined sharply on more profit booking emerged. NSE Nifty registered a third straight declining day. It closed at 22,704.70 points with 183.45 points or 0.80 per cent decline. The Nifty Pharma is the top gainer with 0.55 per cent, followed by CPSE with 0.37 per cent. The Nifty Metal, Media, and Smallcap indices closed with modest gains. The FinNifty is down by 1.65 per cent, is the top loser. The Bank Nifty is down by 1.36 per cent. The IT and Oil and Gas indices declined by over one per cent. All other indices closed with less than per cent decline.
The market breadth is negative as 1,478 declines, and 1,121 advances. About 72 stocks hit a new 52-week high, and 103 stocks traded in the upper circuit. Mazdock, Cochinship, HDFC Bank, and HAL were the top trading counters on Wednesday, in terms of value. Nifty continued its downside move with more profit bookings before the monthly expiry. It closed below the prior parallel highs. It closed below the crucial supports 5-EMA and 8 EMA. The volumes were higher than the previous day. The index declined by 425 points or 1.84 per cent from Monday’s all-time high.
Currently, it is trading below the prior breakout level. In any case, if it closes below 22,790, we can assume that the index has registered a failed breakout. Now, the 20DMA is the nearest support at 22482, which is just 0.96 per cent away. The MACD line is declining, and the Histogram indicates a decline in the bullish momentum. The RSI again back into the neutral zone.
The Index has already erased 50 per cent of the previous week’s gains. The Nifty is formed by a dark cloud cover candle on a weekly chart, which is bearish. The Stochastic RSI has given a fresh, bearish signal. On an hourly chart, it opened below the moving average and sustained. End of the day, the Moving average ribbon entered into a downtrend, and the MACD was below the zero line, which is a bearish signal. Now, a move above Wednesday’s high of 22,825 is positive. As long as it is below this level, be with a bearish view.
(The author is Chief Mentor, Indus School of Technical Analysis, Financial Journalist, Technical Analyst, Trainer and Family Fund Manager)

