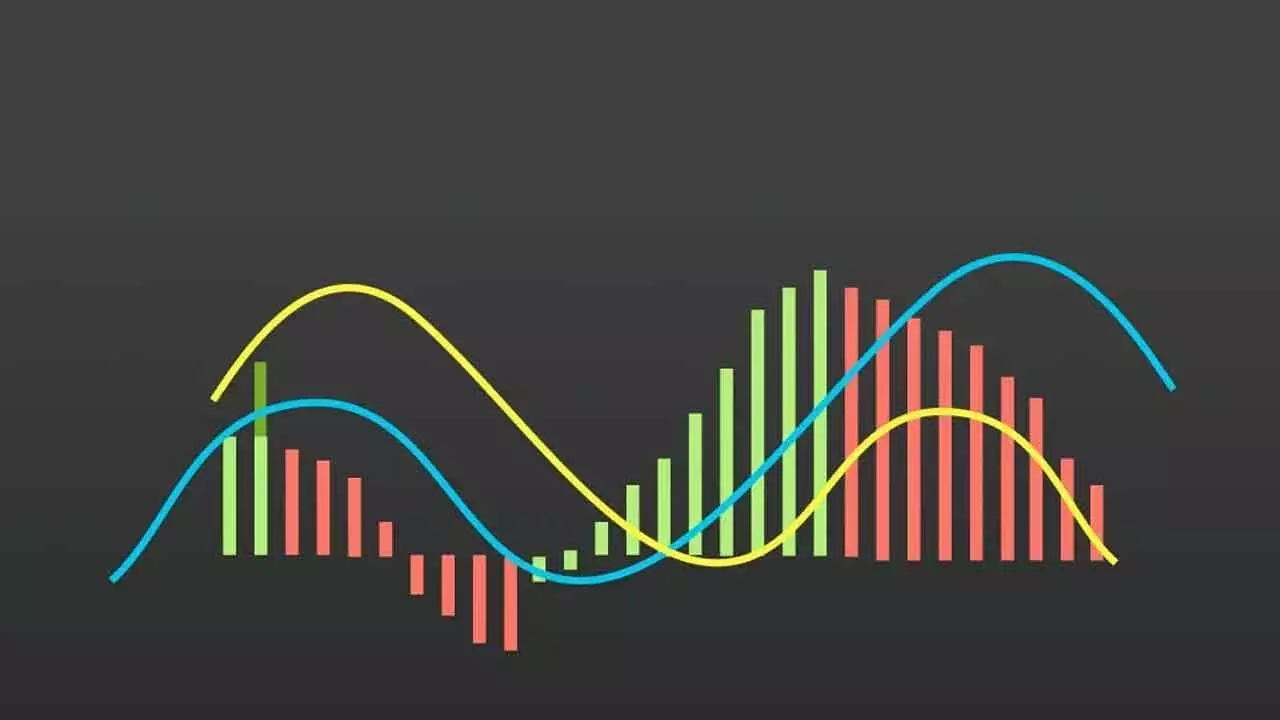
MACD-Histogram Indicates Easing Bullish Momentum
In any case, Nifty closes below 23,304 will be negative and confirms the end of the counter-trend rally; It may test below the previous low of 22,786 level
MACD-Histogram Indicates Easing Bullish Momentum

Nifty is forming lower highs and lower lows. The recent high of 23807, which is the swing high, is the crucial resistance for now. Before that, the 200EMA (23617) and 50DMA (23736) are the hurdles
The equity benchmark indices closed negative for the fourth consecutive day. NSE Nifty declined by 178.35 points or 0.76 per cent and closed at 23381.60. All sectoral indices were down today. The Realty index is down by 2.99 per cent, and the Metal index declined by 2.64 per cent. The Microcap, Media, Consumer Durables, CPSE, PSE, Healthcare, Energy, Midcap, and Smallcap indices declined by over two per cent. All other indices are down by 0.21 per cent to 1.86 per cent. The India VIX is up by 5.55 per cent to 14.44. The Market breadth is extremely negative as 2258 declines and 627 advances. About 153 stocks hit a new 52-week low, and 179 stocks traded in the lower circuit. Mazdock, HDFC Bank, M&M, Swiggy, and Bharti Airtel were the top trading counters in terms of value.
The Nifty closed below the prior day low. It almost tested the 20DMA. The volumes were lower, and the index escaped the distribution day. The Nifty also closed below the 38.2 per cent retracement level of the recent upswing. It came closer to the 50 per cent retracement level. Now, the Bollinger bands flattened. The MACD line failed to move above the zero line, and the histogram shows a significant decline in the bullish momentum. On extreme negative market breadth, all the sectoral indices closed in red. The Volatility index, India VIX, is up by 5.32 per cent, hinting at more volatility days in the near term. Now, the index is trading below all key moving averages except 20DMA. It is 2.76 per cent below the 200DMA and 1.49 per cent below the 50 DMA. The Nifty is forming lower highs and lower lows. The recent high of 23807, which is the swing high, is the crucial resistance for now. Before that, the 200EMA (23617) and 50DMA (23736) are the hurdles. The RSI is back to the 47 zone. In any case, the Nifty closes below 23304 will be negative and confirms the end of the counter-trend rally. It may test below the previous low of 22786 level.
(The author is partner, Wealocity Analytics, Sebi-registered research analyst, chief mentor, Indus School of Technical Analysis, financial journalist, technical analyst and trainer)

