Key indices hovering in directionless trading
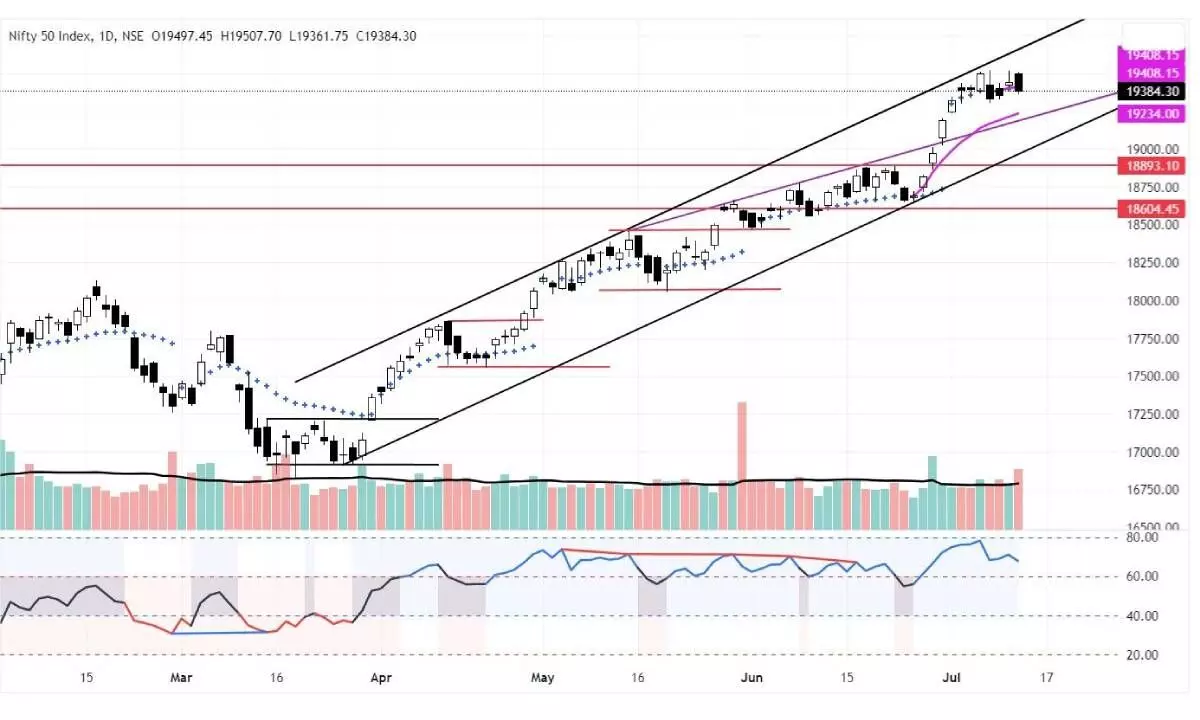
RSI is declining in the bullish zone; MACD histogram shows a further decline in bullish momentum
image for illustrative purpose

The equities further consolidated in the range as NSE Nifty closed lower by 55.10 points or 0.28 per cent and settled at 19,384.30 points. The PSU Bank index is the top gainer with 0.83 per cent and Nifty IT index is the top loser with 0.71 per cent. All other indices closed with less than half a per cent lower or higher. The India VIX again declined to 10.93. The broader market breadth is positive as the advance-decline ratio is at 1.06. About 147 stocks hit a new 52-week high, and 69 stocks traded in the upper circuit. HDFC twins, LTIM, and Reliance, were the top trading counters today in terms of value.
Another bearish candle at a confluence of an all-time high is certainly not a good sign. The benchmark index engulfed Tuesday’s Shooting Star candle. With this strong bearish candle, the Nifty is not in a hurry to form another all-time high. The current consolidation is four days old now and may extend for another 3-4 days. The expansion of the Bollinger bands started contracting as the lower band was rising. Now, the Nifty is just 1.78 per cent above the 20DMA. It closed below the monthly VWAP with a higher volume in the last nine days. On a decline of 0.21 per cent, the higher volume, the Nifty registered a distribution day.
The fact is that the index is still in the last Friday’s range. The RSI is declining in the bullish zone. The MACD histogram shows a further decline in bullish momentum. On an hourly chart, the Nifty closed at the lower support of the moving average ribbon, and the MACD line is approaching the zero line. The hourly RSI is near the 40 line. As we expected, within the range, the intraday volatility has increased. Interestingly, none of the sectors or thematic indices gained or lost by over one per cent. The index breadth is negative as 28 of Nifty-50 stocks closed negative. As mentioned earlier, Friday’s range, 19303-513, has to breach for a directional bias. On the downside. The Anchored VWAP support is at 19,234 points. Only below this level, we can expect more selling pressure. Stay neutral in the range.
(The author is Chief Mentor, Indus School of Technical Analysis, Financial Journalist, Technical Analyst, Trainer and Family Fund Manager)

