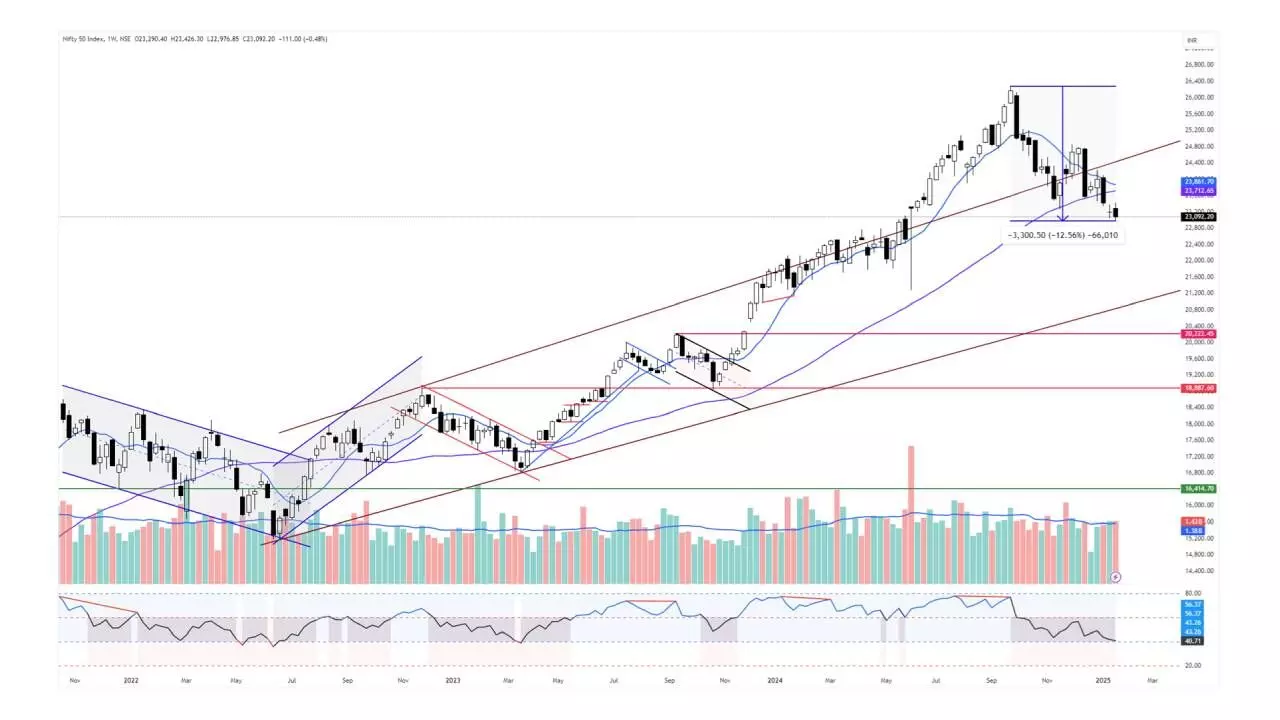
Investors chary of indecisive trading
Nifty formed a bearish engulfing candle with high volume on a weekly chart
Nifty is trading much below the long-term averages. It is 3.72% below the 200DMA and 2.62% below the 50-week average. The distance between 200DMA and the price is the highest level after the March 2023 level. The 200EMA entered a downtrend this week

NSE Nifty closed lower for the third consecutive week. It is down by 0.48 per cent. The BSE Sensex declined by 0.56 per cent. The broader market indices, Nifty Midcap and Smallcap indices, were sharply lower by 2.46 per cent and 4.05 per cent, respectively. On the sectoral front, Only Nifty IT was up by 2.9 per cent, and the Private Sector Bank index advanced by 0.49 per cent. All other sectoral indices ended in red. The Nifty Realty is the top loser with 7.7 per cent. Nifty Media and Auto indices declined by 2.71 per cent and 2.18 per cent, respectively. The FIIs sold Rs69,080.14 crore, and the DIIs bought Rs66,944.50 crore this month. The India VIX is up 6.33 per cent to 16.74.
Equities continue to be in correction mode as the benchmark index, Nifty, declined and made a lower low. The index has formed a bearish engulfing candle with high volume on a weekly chart. It also formed a Shooting Star candle on Friday, showing that the undertone is strongly bearish. As of date, there are no signs of the pre-budget rally. As the monthly expiry is scheduled for Thursday, the short-coverings and the rollovers will influence the market direction. The lot sizes are increasing from the February series, and the volumes in the derivative segment will decline. The FIIs are holding the highest short positions in the index, though they have been decreasing for the last two days.
The Nifty is trading much below the long-term averages. It is 3.72 per cent below the 200DMA and 2.62 per cent below the 50-week average. The distance between 200DMA and the price is the highest level after the March 2023 level. The chances of mean reversion are also higher if the distance is far away. The 200EMA entered a downtrend this week. The 50DMA closed below the 200DMA and registered a Death Cross, which is a long-term bearish signal. The zone of 200DMA (23,984) and 200EMA (23,647) will act as strong resistance. The 50-week average is also placed at a similar level of 23,712. The last nine-day consolidation zone of 22,976-23,426 is the immediate support and resistance. The Nifty must close above the 23,426 for an upside move. In any case, it closes below 22,976 points; the next immediate support is at the 22,800-860 zone. The index corrected by 12.56 per cent from the all-time high and almost completed the Category-1 correction.
Before the budget, the index may not move out of the 22,800-23,600 zone. This 800-point zone is very crucial for the future direction. The General Budget will act as a trigger for the future direction out of this zone. Due to the Budget on Saturday, next week we will have six sessions. The next will be highly volatile also. The market may witness a risk-off sentiment, and the trading volumes may decline in this background. Be very careful about the position size. It is better to stay on the sidelines.
Relative Rotation Graphs (RRG) shows that there is no sector is in a position to lead the market. The Nifty Realty, Bank Nifty, Financial Services Index, and the Midcap-100 Index are inside the leading quadrant. Except for the Midcap-100 Index, the rest are showing a decline in their relative momentum. The Nifty IT index has rolled inside the weakening quadrant. However, stock-specific performance may be seen from this space. The Nifty Pharma and the Services Sector Indices are also inside the weakening quadrant. The Nifty Metal, Media, PSE, Energy, FMCG, Consumption, and Commodities Indices are inside the lagging quadrant. Most of these sectors are showing sharp improvement in their relative momentum.

