Indicators show stronger trend
The domestic market closed higher with another over one per cent gain.
image for illustrative purpose

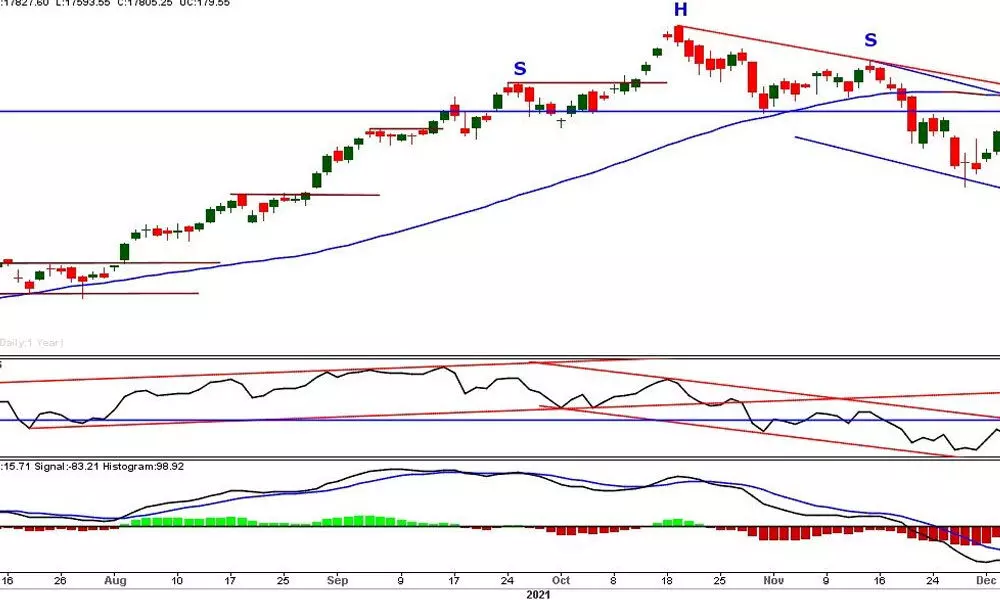
The domestic market closed higher with another over one per cent gain. The frontline index, Nifty up by 179.55 points and settled at 17805.25. With the reclaiming 17800 level, the Nifty has shown early trend reversal signs. The Energy index is the top gainer with 2.28 per cent. Bank Nifty, Infra, and PSU Bank indices advanced by over one per cent. Nifty Pharma, Metal, and Realty indices down by 0.50 per cent. The VIX is down by two per cent. The market breadth is slightly positive as 1079 advances and 980 declines. About 201 stocks hit a new 52-week high, and 192 stocks traded in the upper circuit.
The market gained over one per cent for the second successive day and ended above the 61.8 per cent retracement of the downtrend. Three consecutive bull candles after two indecisive doji candles indicate a stronger market. The benchmark index also closed decisively above the prior swing high. This price structure indicates a trend reversal on the upside. The RSI entered into a strong bullish zone. The MACD line crossed the zero line. These indicators show a stronger market trend. The current up move is sharper than earlier upswings and longer. The momentum is stronger, which is mirrored in the histogram. The retracement is faster and sharper than expected. To a standard technical analysis, the trend is reversed. But, there are concerns about this sharp upside reversal. The Relative Rotation Graphs (RRG) shows, out of 50 stocks in Nifty, very few, less than five stocks are building the momentum in relative strength compared to the broader market.
Many of the stocks in the leading quadrant are losing their relative momentum. And 90 per cent of the stocks are on the south side of the quadrants. The Nifty stocks do not have stronger relative strength than the broader market. A few stocks move higher and push the index on the upside. This weaker inherent strength is giving any conviction on the trend. But, as long as the price is not closed below the prior bar low, continue with the trend. The 78.6 retracement level is at 18130, which may act as strong resistance. At the same time, a move below 17639 will signal another round of counter-trend. As the global market is opening after the holiday season, we may get clues for the immediate trend. Trade cautiously optimistic.
(The author is financial journalist, technical analyst, family fund manager)

