Current rally may extend beyond 18,140pts
Daily RSI and MACD lines reached over-bought condition after rhe December high; The weekly RSI is at 56.29 is near the strong bullish zone
image for illustrative purpose

It was a very good week for optimistic traders as the equities rallied all five sessions of the week. The benchmark index, Nifty, rallied by 440.95 points or 2.5 per cent. BSE Sensex is also up by 2.4 per cent. The broader market indices, Midcap-100 and Smallcap-100, advanced by 2.3 per cent and 3.2 per cent, respectively. On the sectoral front, the PSU Bank index is the top gainer with 7.3 per cent, followed by the Realty index, up by 5.2 per cent. All other sectoral indices ended with decent gains. The India VIX is down by 5.76 per cent to 10.95. The Advance-Decline Ratio is positive during the week. During April, the FIIs bought Rs5,711.80 crore and the DIIs bought Rs2,216.57 crore worth of equities.
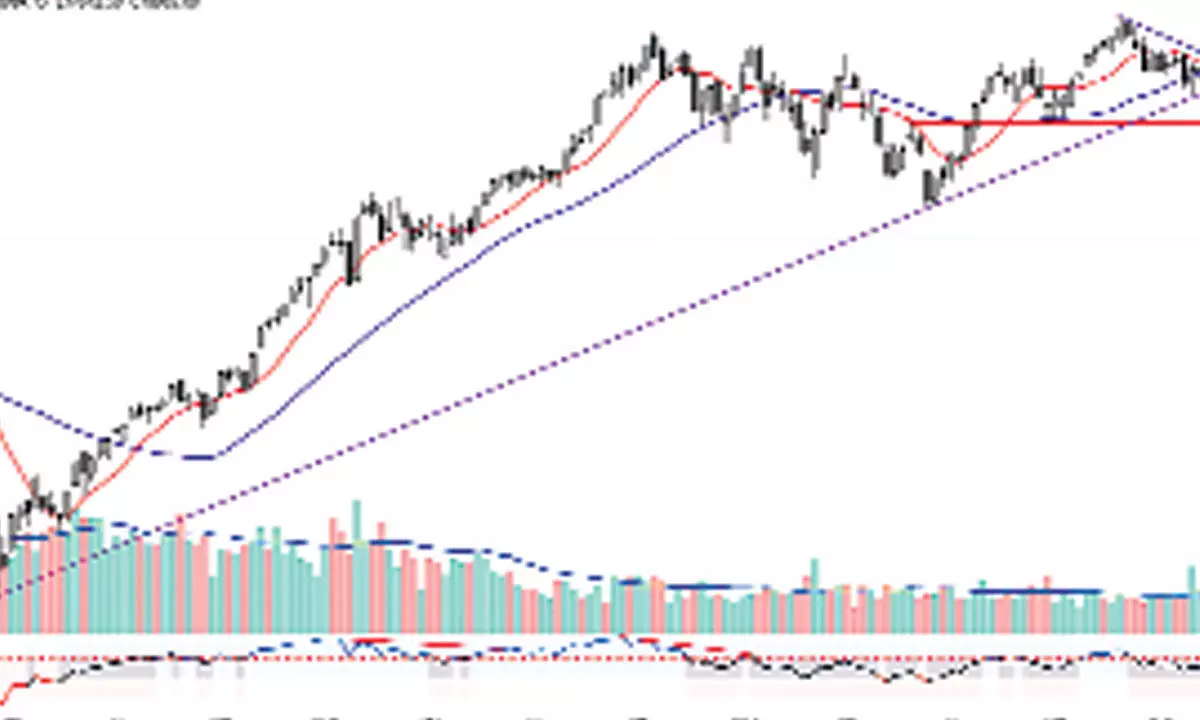
The Nifty closed above the last month’s Doji candle high. It has registered one of the best weekly gains. Last week’s bearish engulfing candle failed to get a confirmation for its implications. It has tested and closed at the resistance at the trendline drawn by connecting two major lows of March 2020 and June 2022. Now, the Nifty is at a 17-week high and above all key moving averages. Nine days rally was consolidated for five days in the previous week. The last week’s five-day rally extended by 50 per cent level (18028) of the previous nine-day swing. The 100 per cent time and price extension level is at 18,503 in the other four days. Before achieving this level, 18140 and 18300 levels may act as resistances. Currently, the Nifty is 2.5 per cent above the 20DMA and 3.18 per cent above the 50DMA. After 14th December 2022, the distance between 50DMA and the index is at the highest level. Its maximum distance from the 50DMA in recent times is 5.78 per cent. In this context, we can expect that the current rally can extend beyond 18140 and can achieve the target of 18500.
In our previous analysis, we mentioned the right shoulder high could be formed at 18134 on a weekly chart. We are almost there now. A 2-5 per cent variation is acceptable symmetry for any pattern. In the process of forming a right shoulder, an inverted head and shoulder pattern emerged and registered a breakout last week on a daily chart. This inverted head and shoulders target is almost at the previous lifetime high. This target can be achieved in another two legs, one down and another one up. Any correction should retrace more than 38.2 per cent in the process of meeting the inverted head and shoulders pattern target.
The daily RSI and MACD lines have reached the over-bought condition after The December high. The weekly RSI is at 56.29 is near the strong bullish zone. If the Nifty closes above 18,300 points, it may shift range into the strong bullish zone. For the near future, as long as it trades above 17858, be with a positive bias. As stated above, the short-term and pattern targets are at 18300 and 18504. A close below 17885 will be a sign of weakness. A close below 17,790 is negative, and it can test 20DMA (17623). Only below these levels the market will turn bearish. Still, then be with cautiously optimistic.
There are some historical concerns regarding the strong bullish bias. The India VIX, known as the fear index, which gauges volatility, is at its lowest levels. It registered the lowest monthly close since July 2010, at 10.92. The VIX’s lowest range is 8.75- 9.02. We can expect some more downside. This means less volatility, and traders feel they are under-invested and taking more exposure to the equities in the process of fully invested. They feel a better risk-taking environment lies ahead. Once this happens, any small spike in volatility will hurt the uptrend. That spike in the VIX will lead to sharp profit-taking, and the benchmark index will witness a sharp decline like nose dive. All the market tops were made when the VIX was at low. This inverse relationship needs to understand, and stay cautiously optimistic now.
(The author is Chief Mentor, Indus School of Technical Analysis, Financial Journalist, Technical Analyst, Trainer and Family Fund Manager)

