Charts indicating indecisiveness
image for illustrative purpose

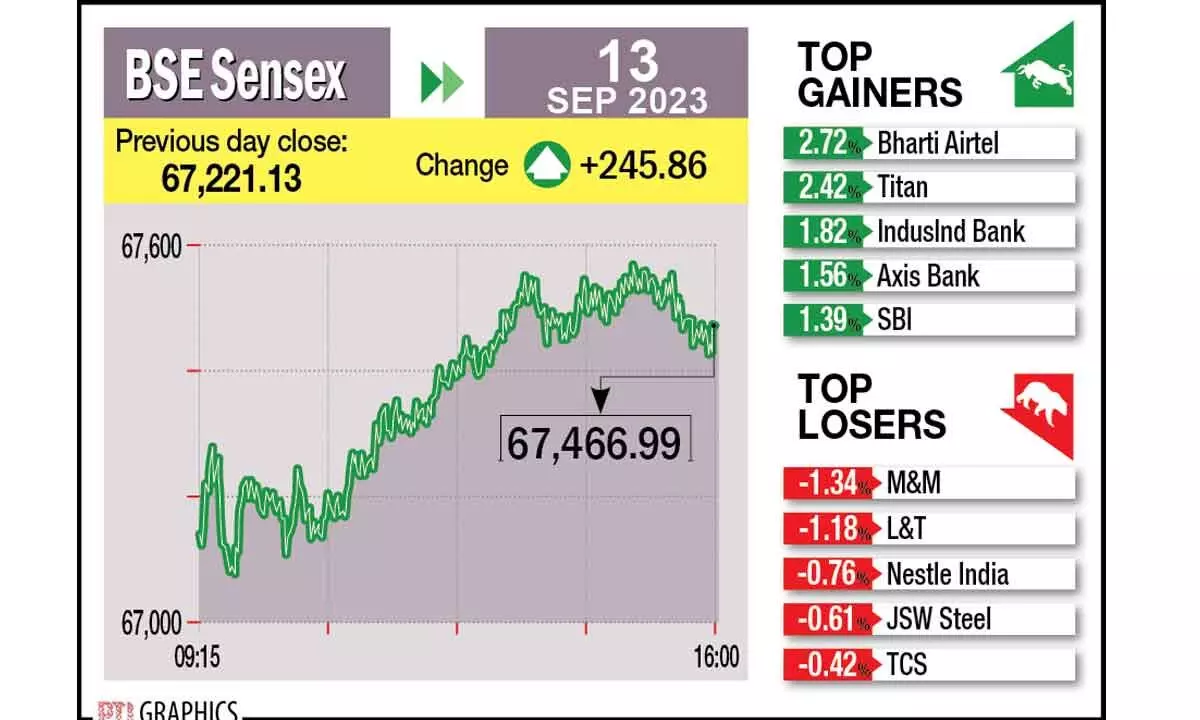
Mumbai: The benchmark indices witnessed range-bound activity at higher levels as BSE Sensex was up by 246 points. Among sectors, PSU Bank index outperformed and rallied over four per cent whereas intraday profit booking were seen in auto and IT stocks. Technically, after a promising uptrend rally, Sensex witnessing range-bound activity.
On daily chart, Sensex has formed inside body candle, which indicating indecisiveness between the bulls and bears.
“We are of the view that, the narrow-range activity is likely to continue in the near future. For the traders now, 67,050-66,900 would act as a key supports zone, while 67,600-67,800 could act as key resistance levels for the bulls,” says Shrikant Chauhan of Kotak Securities. The current market texture is volatile. Hence, buying on dips and sell on rallies would be the ideal strategy for the day traders.

