Charts indicate weakening bullish strength
Key indices set to move on pure demand-supply dynamics
image for illustrative purpose

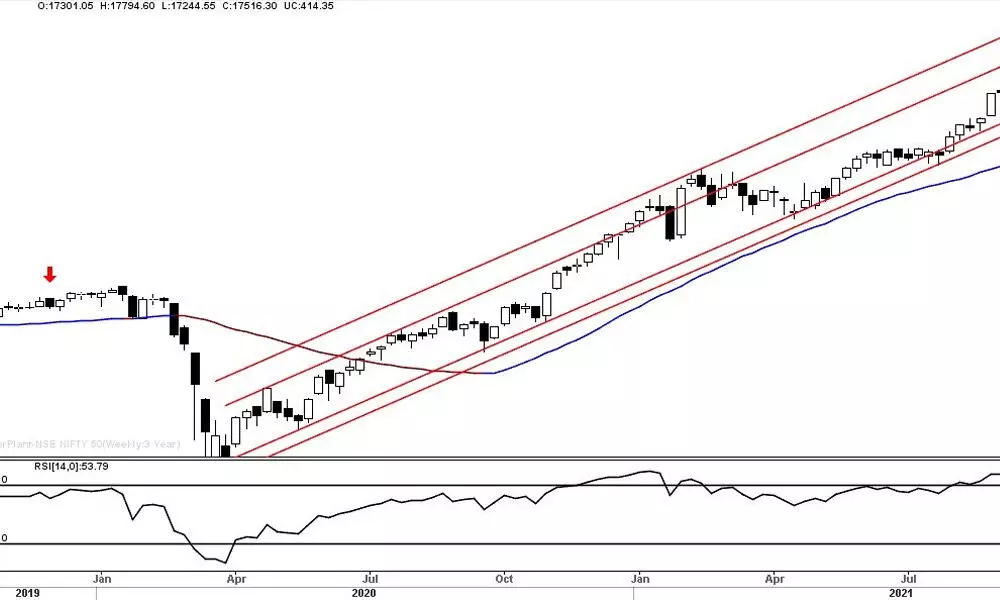
The domestic equity market moved with high volatility in the budget week. A busy week came to an end as the event risk concluded. During the last week, the benchmark index NSE Nifty was up by 414.35 points or 2.42 per cent. The BSE Sensex was also up by 2.5 per cent. The broader market indices Nifty Midcap-100 and Smallcap-100 indices advanced by 2.1 per cent and 1.9 per cent, respectively. On the sectoral front, the Nifty Metal is the top gainer with 6.6 per cent. The Bank Nifty, FMCG, IT and Pharma indices closed 3 - 4.5 per cent higher. The India VIX is down by 8.68 per cent as the event risk is over. FIIs sold Rs4,070.79 crore, and the DIIs bought Rs2,275.06 crore worth of equities during the last four days.
The Nifty snapped it two weeks of decline by taking support at 30 weekly average. The equities tried to consolidate in the budget week in volatile conditions. The trading range is confined to 550 points, a smaller budget week range than the previous weeks. During the last year's budget week, the Nifty traded in the 1270 points range. Fifty per cent gains were erased because of profit booking at the weekend. The benchmark index has formed along the upper wick candle looks like a shooting star. It stuck between 20 and 50DMAs. It decisively closed below the 50 EMA. Next week, we may get confirmation that the five-day sharp rise was a counter-trend or a bear market pullback. The index already retraced below 23.6 per cent of the prior upswing. The 38.2 per cent retracement level is at 17428. Incidentally, the 50SMA support also placed at 17438. This cluster of support is crucial at the beginning of the week. Below this level, it may have a chance to test 17202.
The Nifty has formed a higher high and higher low candle on a weekly chart. But it failed to form a swing high or swing low and did not give any directional bias to the market. The 30 Weekly Moving Average acted as a support. But failed to close above the 20 Weekly moving average. And the 20WMA began its downtrend. His precarious non-directional movement, particularly in a budget week, indicates that the market failed to get a significant strength. Importantly, the budget event was already digested and discounted. Now, the market will move as per the demand-supply dynamics.
On the indicators front, the daily 14 period Relative Strength Index (RSI) is below 50 and entered the neutral zone. The MACD line is also below the signal line and zero line. Notably, the negative directional movement indicator is above the positive directional movement indicator +DMI. The ADX is declining. These daily indicators signify the bullish strength in the market is not so great. In fact, bulls are losing control of the trend. The Elder impulse system is showing the neutral bias. At the same time, Elder Ray indicator clearly displayed the decline in the bull power. The Nifty fell below the Anchored VWAP, plotted at the recent intermediate swing high.
With the above technical evidence, the market is trading in a neutral zone between 20 and 50DMAs. Unless a consensus directional bias arrives, the index may not give a clear trade on either side. While trading, keep in mind that the resistance zone of 17794-737 and the support zone of 17428-438. A breakout on either side will give a clear directional trade.
(The author is Chief Mentor, Indus School of Technical Analysis, Financial Journalist, Technical Analyst, Trainer and Family Fund Manager)

