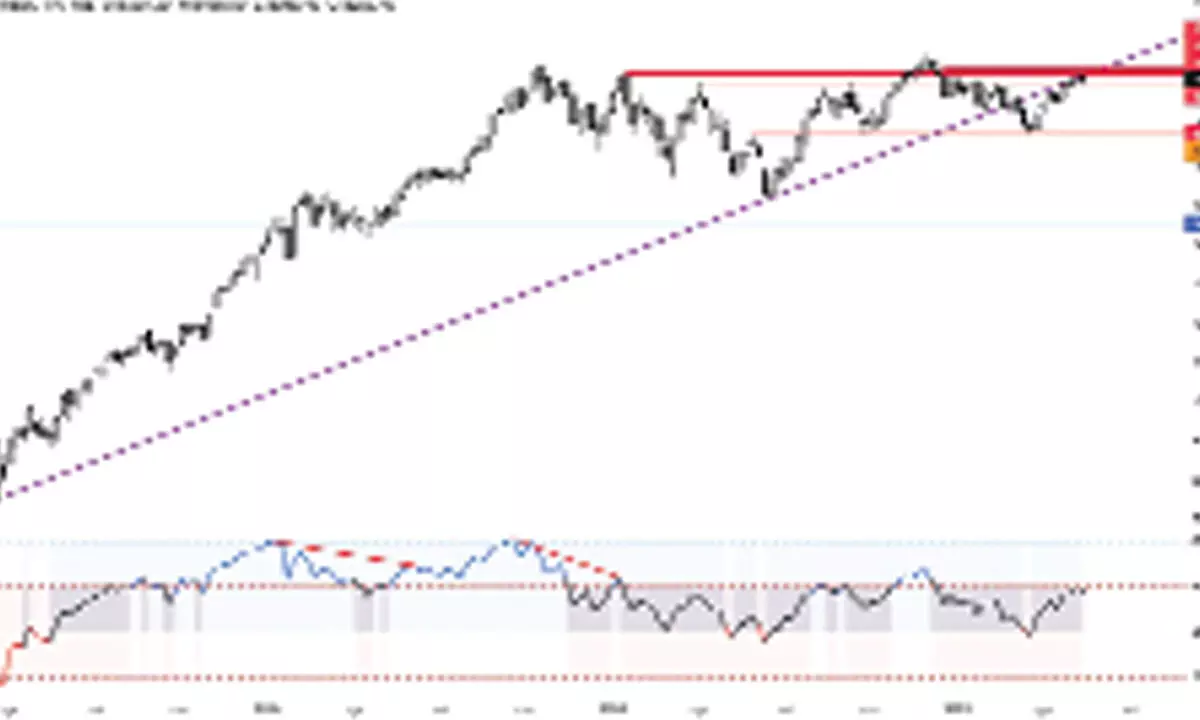
Charts indicate trend exhaustion
Nifty has formed a Dark Cloud Cover candle at the swing high; It also formed a higher high, lower low, and an outside bar; As the monthly derivatives expiry is scheduled this week, a small spike in volatility index will hurt the bulls
image for illustrative purpose

The Indian benchmark indices snapped a three-week winning streak on a profit bout. NSE Nifty ended the week with 111.40 points or 0.61 per cent. BSE Sensex declined by 0.48 per cent. The broader market indices, Nifty Midcap-100 and Smallcap indices, outperformed as they gained 0.25 per cent and 0.86 per cent, respectively. The Nifty Realty is the top gainer with 1.28 per cent, followed by Nifty IT with 0.98 per cent. On the other hand, the Nifty Pharma and Media indices are down by 2.90 per cent and 2.05 per cent, respectively. The Advance-Decline ratio is mostly negative. The FIIs continued to buy equities except on Friday. As of date, they bought Rs17,376.31 crore during this month. The DIIs sold Rs4,674.68 crore worth of equities.
The Nifty has formed a Dark Cloud Cover candle at the swing high. It also formed a higher high, lower low, and an outside bar. These alternate bearish formations show the exhaustion of a trend and increased volatility. After failing to get the bearish confirmations for the previous week’s Shooting Star, this bearish bar has significance. The Nifty tested the key support of 20-Day Moving Average and also formed an expanding or a broadening triangle on a lower timeframe. Normally, the broadening formations at the top are bearish. On the weekend and before the expiry, the market participant covered their short positions, resulting in a sharp recovery on Friday. After many days, the index has registered two distribution days during the week. It has broken down the rising wedge patterns and met 70 per cent of its target. As the Nifty was almost done with the mean reversion, the Bollinger bands began to contract. It hints that the Nifty may consolidate within the previous week's range of 18060-459. This 400 points range is crucial for the trend. Either side breakout will result in a directional move. In any case, if the Nifty closes below the 20DMA (18107), it can test the 50DMA of 17665, which is also the 50 per cent retracement level (17663) of the prior upswing. Before testing this, it may take support at 17,836 points. Friday’s low is very crucial short-term support, as it was a confluence of 20DMA and a 23.6 per cent retracement level.
During the last eight weeks of an upswing, the Nifty never closed below the previous bar’s low. So, a lower close is also important for the trend reversal. Friday's low is also almost three week low of 18,042 points. This parallel has significance as it is a broadening formation’s support line. If it closes below the 18042, expect a 400-point decline in the Nifty, which is equaled to 50DMA and 50 per cent retracement levels. Interestingly, the previous correction ended at the 23.6 per cent retracement level. Currently, retraced again at 23.5 per cent and holding for now. Any decline below this will result in a continuation of profit booking.
In a bull case scenario, first, the Nifty has close above Friday’s high of 18,218 and then formed a weekly higher high, which is moving above 18459. The Nifty may face resistance at the 18450-500 zone in the short term.
The India VIX declined again. Last week it was down by 4.28 per cent to 12.30. As the monthly derivatives expiry is scheduled this week, a small spike will hurt the bulls. The market may see more adjustments by rollovers. The dollar index (DXY) continued to be higher, which is another negative factor for the equity markets. The CBOE VIX index also rose by 4.74 per cent on Friday, indicating the volatile days to come. We may have some stock-specific activity with as many as more than 1,300 companies to announce the earnings next week. Stay focused on better earnings growth stocks. A highly selective bias is recommended and to protect the profits.
(The author is Chief Mentor, Indus School of Technical Analysis, Financial Journalist, Technical Analyst, Trainer and Family Fund Manager)

