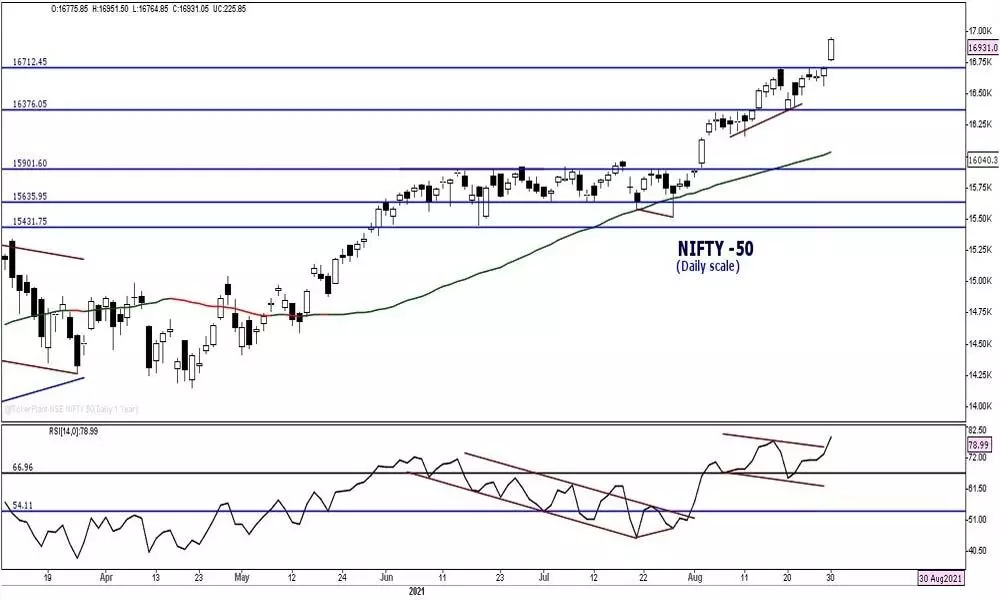
Charts indicate overbought zone
MACD histogram shows the strong bullish momentum; It’s advised to be cautiously optimistics
image for illustrative purpose

The equity market rallied sharply by 225.85 points and closed at the highest level of 16,931.05 points. Barring the Nifty IT, all the sectoral indices registered decent gain. The Metal, Bank Nifty and Financial services indices rallied by two percent. All the sectoral indices up by over one percent. IT index down by 058 percent. The India VIX ended flat. The overall market breadth is positive, as 1,395 advances and 581 declines. About 110 stocks hit new 52 week high, and 196 stocks traded in the upper circuit.
The benchmark index moved with renewed bullish strength. 65 percent of the ascending triangle met. The Nifty is almost near to our initial target of 17,000 points. With 240 points rally, it has registered strong gain after August 3. The strong momentum indicates that the strength in the market. The broader market participation and the Bank Nifty breakouts are the positive triggers to the market in the near term. With Monday's big move, the Nifty closed above the Bollinger upper, indicates an overbought condition. The RSI is in the extreme overbought condition in daily and weekly charts. The daily RSI closed above the prior swing high. MACD histogram shows the strong bullish momentum. During the last month, the Nifty rallied over 7.41 percent. This is the highest monthly gain after November 2020. As the Nifty trading in the uncharted territory with strong bullish strength, avoid taking a short position. Though it reached the channel resistance line and overbought condition, it is advised to be cautiously optimistic.
(The author is financial journalist, technical analyst, family fund
manager)

