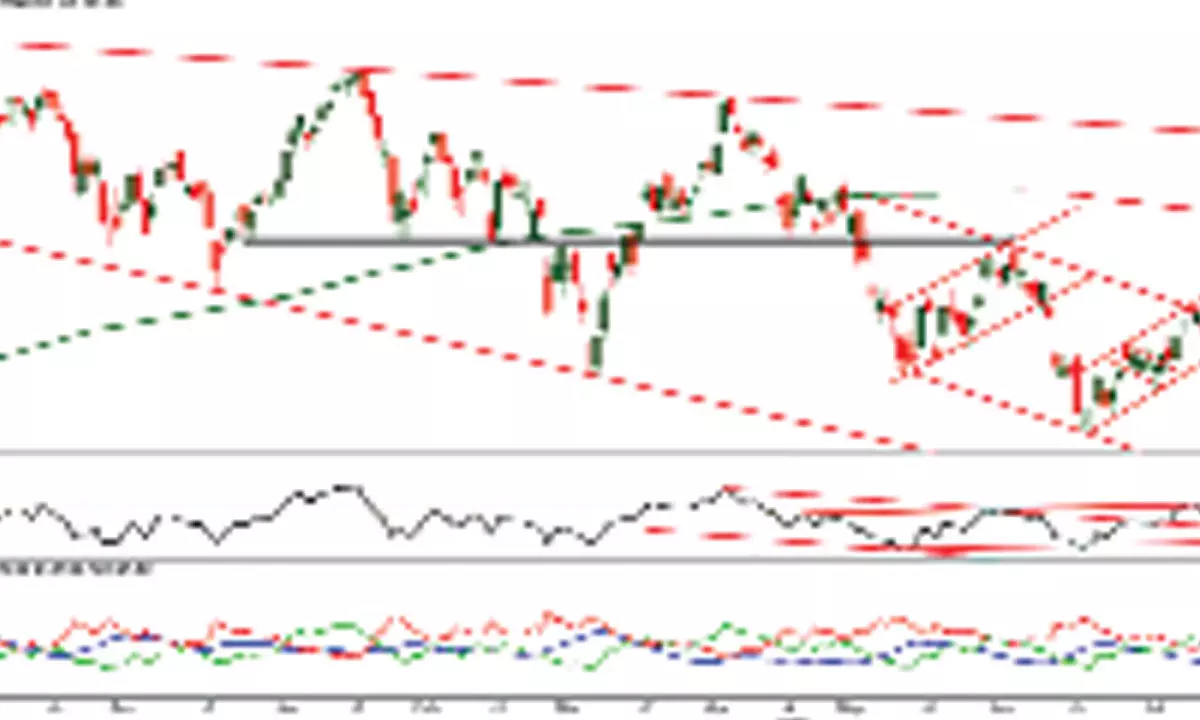
Charts indicate over-extension of rally
The RSI has reached above 75 zone, which is an extremely overbought condition
image for illustrative purpose

Dalal Street rallied as the broader market participation increased. NSE Nifty gained 181.80 points or 1.06 per cent and closed at 17,340.05 points. The Nifty Auto index is the top gainer with 3.27 per cent, as the July sales number were exuberant. The Media gained by 2.3 per cent. The Infra, Metal and the Banknifty gained over one per cent. Only the Pharma index is down by just 9.70 per cent. The other sector indices are up by less than a per cent. The Market breadth is positive as 1391 advances and 493 declines. About 74 stocks hit a new 52-week high, and 135 stocks traded in the upper circuit. Tata Motors, Reliance and M&M are the top trading counters in terms of value.
Another day of strong close indicates the broader participation in the market. The benchmark index Nifty gained 917 points of 5.5 per cent in just four days, with three huge gaps.
Post Federal Reserve's commentary on the economy, the global markets are also trading positively. The RBI's monetary policy is scheduled this week. It may be a trigger point in the near term. Most of the indicators have reached the extremely overbought zone.
From here, the market may be positive, but the upside is limited. It may witness the profit booking at some point in time. The trialling stop loss is the only method to protect the profits.
The Nifty moved 1.88 per cent above the 200DMA and 7.31 per cent above the 50DMA. The Nifty is now 5.73 per cent above the 20DMA. This shows the over-extension of rally. The RSI has reached above 75 zone, which is an extremely overbought condition. The earlier swings ended when the RSI reached the 65-70 zone. This time is a little higher. On the occasion of a lifetime high of 18604, the RSI is at 77. It formed a negative divergence as the previous high was at the 85 zone. The +DMI is above the prior highs. For the second day, the index is closed above the upper Bollinger band. It entered 18th April's gap area. As mentioned earlier column, the targets are open to 17700-900 zone of resistance.
At the same time, we need to watch the index behaviour around the 17450-650 level, which is gap area resistance. On a 75-minute chart, the MACD line is continuously declining. Even the RRG RS indicator shows that the momentum is in good shape, but the RS-Ratio is still below 100. For now, there is no weakness in the market, be with the trend. Be ready for event risk with trialling stop loss.
-(The author is Chief Mentor, Indus School of Technical Analysis, Financial Journalist, Technical Analyst, Trainer and Family Fund Manager)

