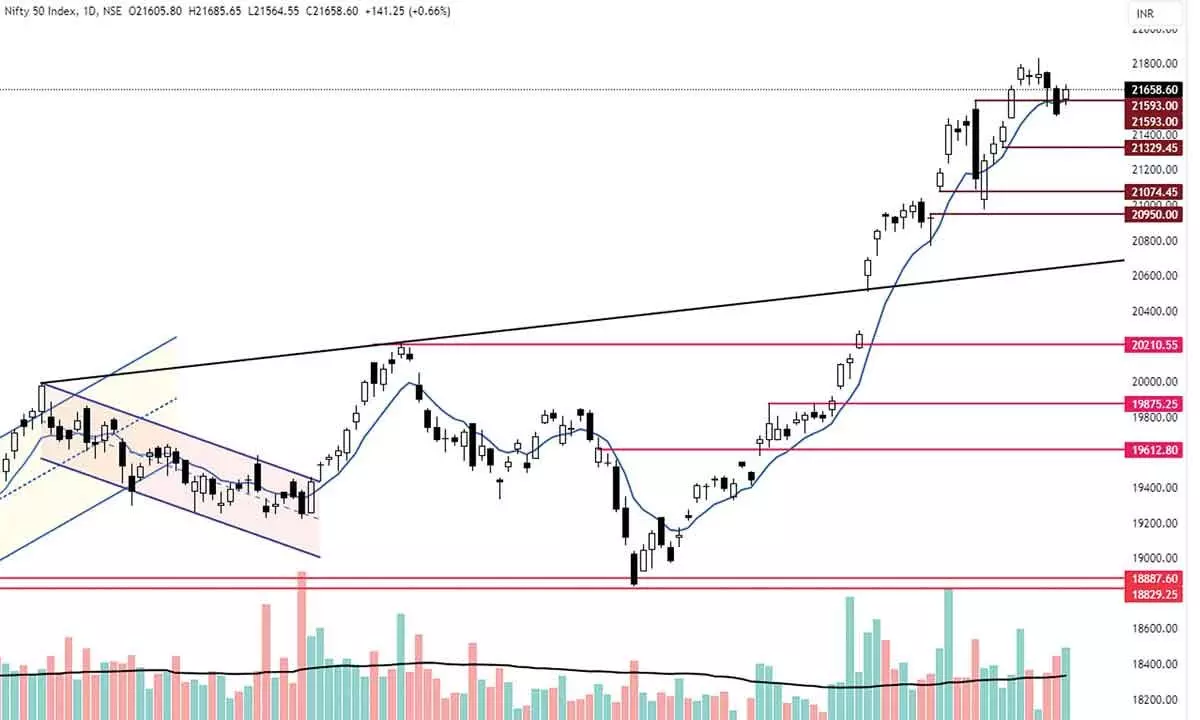
Charts indicate indecisiveness in market
Benchmark index formed a higher high and low candle with last hour’s bounce
image for illustrative purpose

Positive Market Breadth
l VIX down by 5.44%
l 1,691 advances
l 874 declines
l RSI bounced over 65
l 255 stocks hit a new 52-wk high
l 177 stocks traded in upper circuit
On the weekly expiry day, the broader market was able to recover with the short covering. NSE Nifty was up by 141.25 points or 0.66 per cent and closed at 21,658.60 points. Bank Nifty and FinNifty led the recovery with 1.03 per cent and 1.22 per cent, respectively. The Nifty Realty is the top gainer with 6.76 per cent. The Nifty Energy, Infra, and PSU Bank indices were up by over one per cent. The India VIX is down by 5.44 per cent to 13.33 level. The market breadth is positive as 1,691 advances and 874 declines. About 255 stocks hit a new 52-week high, and 177 stocks traded in the upper circuit. HDFC Bank, ICICI Bank, RPower, and Bajaj Finance were the top trading counters today in terms of value.
The Nifty has formed a higher high and low candle with the last hour’s bounce. It traded sideways within the prior day’s range till the last 30 minutes. Thursday’s price actions have not provided any directional view, even though it closed positively.
As the weekly derivatives expiry, there are some adjustments and the short coverings. Because of this, the last hour has seen an increase in activity. On a subdued trading session, the index is able to close higher, with a decent above-average and higher than the previous day’s volume. The interesting factor is that the broader market participation. The market breadth is extremely positive as 1,691 advances. The banks and financials led Thursday’s recovery. All the sectors participated in Thursday’s session. The MACD histogram shows that there is no improvement in the momentum. The RSI bounced after taking support at 65, but it is below 68, which is crucial for the uptrend now. Now, the 21,677 level has become a crucial level. A close above this will give room for an upside move. On a weekly chart, the index forms a long-legged, small-body candle, indicating the resting period for the index. From the short-term perspective, this week’s range of 21,500-21,834 will be a deciding factor for a directional bias. Either side breakout will result in a decisive move. The weekend close may not give a clue, as it is forming an indecisive candle. If the Nifty closes negative in the next week, we may see more correction in the broader market.
(The author is Chief Mentor, Indus School of Technical Analysis, Financial Journalist, Technical Analyst, Trainer and Family Fund Manager)

