Charts indicate caution this week
In any case, if Nifty forms a lower low followed by a lower high, it is better to be bullish for now.But stay cautious of the next week as the index may decline next week
image for illustrative purpose

The benchmark indices closed at a record high. NSE Nifty gained 183.35 points or 0.99 per cent during the last week. BSE Sensex is up by 0.92 per cent. The Nifty Midcap-100 and Smallcap-100 indices are advanced by 3.1 per cent and 2.34 per cent respectively and outperformed benchmark indices. The Media and Realty indices are the top gainers with 4.18 per cent and 4.15 per cent, respectively. During November, FIIs bought Rs22,546.34 crore, and the DIIs sold Rs6,301.32 crore worth of equities.
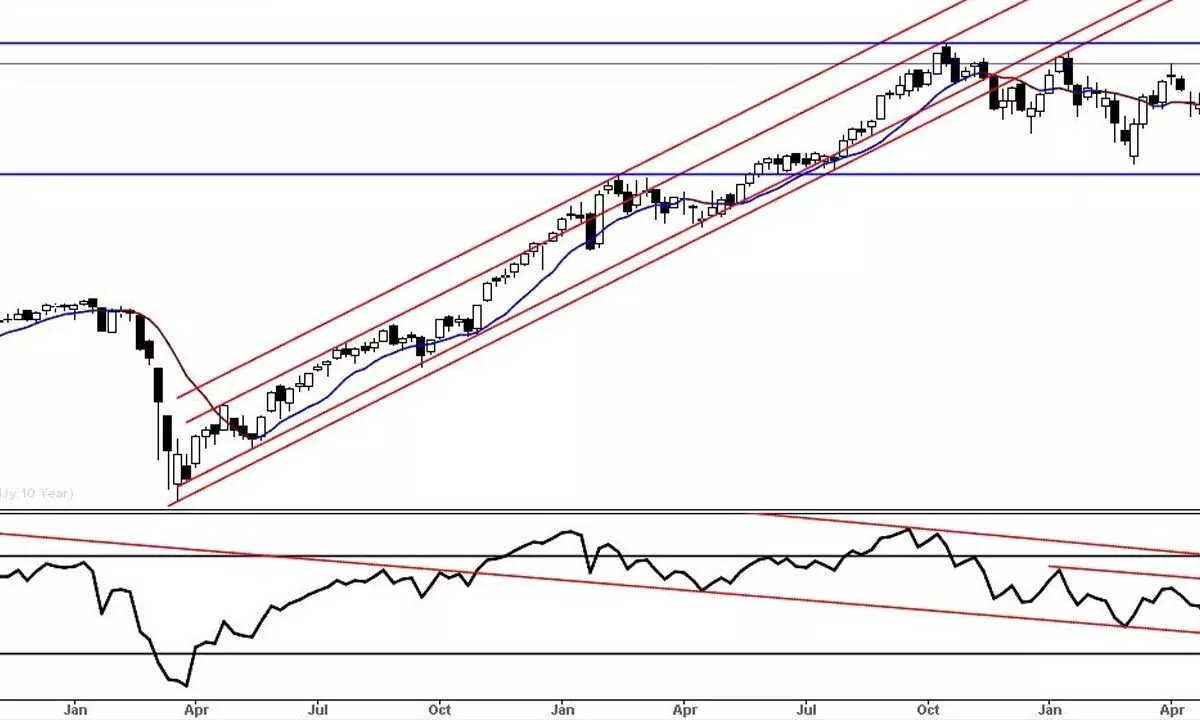
The Nifty closed at an all-time high on a weekly basis after 13 months. As it formed a new higher high, in all practical purposes, we are in a new bull market. A majority of indicators are still not yet reached the overbought condition on a weekly chart. This indicates the probability of more rallies is on the cards. Friday's decline is only a pullback of eight-day rally. This pullback is common in minor trends. As we mentioned last few weeks, there are no weaknesses in the shorter period chart. But Friday's move indicates the possibility of testing the six-day base breakout level of 18442 and 20DMA of 18388. In any case, in the most bear case scenario, the current swing low of 18114 can be tested. Only below this level on a closing basis the intermediate trend will be a bearish one.
The Weekly RSI shifted range to the bullish zone after 13 months. During this period, it spent time in the 40-60 range, exactly in the downtrend period. Before that, the RSI was in the above 60 zone; soon after, it moved above the January 2020 high after a most bearish move of March 2020. Still, it is not in the overbought zone, and more uptrend possibility is visible. The Nifty closed above the 61.8 per cent retracement level of the prior swings. Importantly, the monthly MACD is about to give a fresh bullish signal. None of the moving averages is showing a bearish signal at present on a longer time frame. The bullish targets at very optimistic. The uptrend and the counter-trend's 38.2 per cent extension target is at 19421. Above this level, the target is 20730, which is a 50 per cent retracement level. The weekly channel resistance line and the 61.8 per cent extension level are at 22039. This ultimate target can be achievable by the end of 2024. At the same, the recent swing 100 per cent extension level is at 19655. With this, medium targets are placed at the 19421 - 655 zone.
With Friday's fall, there are concerns in the short term. If you are looking for trading in five days, it is certainly a bearish outlook. The Nifty has formed an Evening Star or a spinning top and got its bearish implications as Friday it closed below the previous day's low. This is a short-term weaker signal. The Nifty also met the monthly channel breakout target on November 30. Only in case of below the 18400, it may retrace towards the 17800 level. Only below this in the most bear case scenario, the Nifty target is at 17061, which is 200DMA and 150DMA. Let us hope this may not happen as per the current conditions.
Global fundamental factors are showing improvement, and the world markets recovered 20 per cent from the October low. The Dollar Index is falling, and it is below the 200DMA, which is positive for equities. The Quantitative Tightening may slow down from now, as the central banks have already hinted at this.
Importantly, most of the bear phases ended in 13 months periods. We have already completed the 13-month correction. In any case, if the Nifty forms a lower low followed by a lower high, till then, it is better to be bullish for now. But stay cautious of the next week. The index may decline next week.
(The author is Chief Mentor, Indus School of Technical Analysis, Financial Journalist, Technical Analyst, Trainer and Family Fund Manager)

