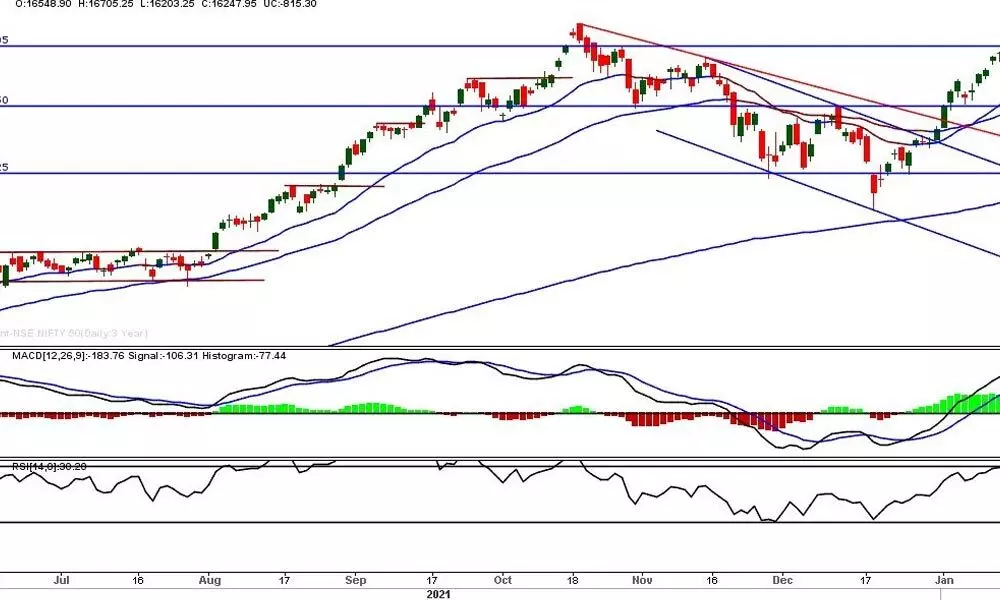
Charts confirming downtrend in markets
Nifty shows long-term reversal sign; Nifty will test sub 14000 level sooner or later
image for illustrative purpose

The geopolitical tensions as the war erupted between Russia and Ukraine, the global equity markets sharply declined. The Indian benchmarks down by over five per cent. The Nifty is down by 4.78 per cent. The majority of sectoral indices are down by over five per cent. The PSU Bank, Realty and Media are the worst hit with 7-8 per cent declines. Pharma and FMCG indices outperformed with a 3.5 per cent loss. The Volatility index India VIX up by 30.31 per cent and settled at 31.98, the highest level after March 2020. Only 167 stocks were able to close in the green and 1955 stocks declined. As many as 264 stocks hit a new 52 week low, and 438 stocks traded in the lower circuit. The crude oil price crossed 104 dollars, which is seven years high. The Gold price trading above $1905 is 13 months high. The Gold price in the domestic market hit Rs53,600. Investors are looking for safe havens, with war situations are escalating.
The domestic equity market entered into a strong downtrend as it has broken all key supports. The benchmark index, Nifty, declined below the 200DMA, which is a long-term reversal sign. It corrected over 12 per cent from its lifetime. The Nifty has a history of correcting at least 25 per cent when it doubled from the bottom. In 2012, it corrected about 28.5 per cent, and in 2015-16, the correction was 25.15 per cent. These are category-2 corrections in the equity market. The 2008 and 2020 corrections are category-3 corrections, and they corrected over 39 per cent and 64.5 per cent from previous tops. History repeats is the philosophy of technical analysis. If the history repeats this time too, the Nifty will test sub 14000 levels sooner or later.
Today, the Nifty markets nosedived for 4.78 per cent, as none of the index stocks were able to close in green. The average sectoral indices decline is over 5 per cent. The Nifty has closed below the major low of 16410 and decisively below the 200DMA. The leading indicators closed in the bearish zone even on the weekly chart. Today's 500 points gap is down and may fill in the near term, but it is not the reversal to the upside. The daily RSI is at 30 zone. In the recent past, the Nifty has bounced from 30. Let us wait for a bounce to exit the market. As we cautioned several times in the recent past, the market is not conducive for fresh purchases. Technically, the market is in a downtrend, and a majority of stocks are also in the confirmed downtrend.
(The author is Chief Mentor, Indus School of Technical Analysis, Financial Journalist, Technical Analyst, Trainer and Family Fund Manager)

