Better to book profits in over-extended rally
In a bull case scenario, if Shooting Star pattern fails to get the confirmation for its implications; we will see extension of rally towards 100% target of 20,525pts sooner
image for illustrative purpose

The domestic equity benchmark indices sky-rocketed to new heights. Last week, NSE Nifty and BSE Sensex, the frontline indices, were up by 0.91 per cent and 0.94 per cent, respectively. The Midcap-100 and Smallcap-100 indices advanced by 0.74 per cent and 1.82 per cent, respectively. The PSU Bank index is the top gainer with 3.96 per cent. The Nifty IT declined by 3.47 per cent, which is the top loser. The Advance-decline ratio is mostly positive. FII bought Rs17,697.89 crore, and the DIIs sold Rs8,906.19 crore worth of equities in the current month.
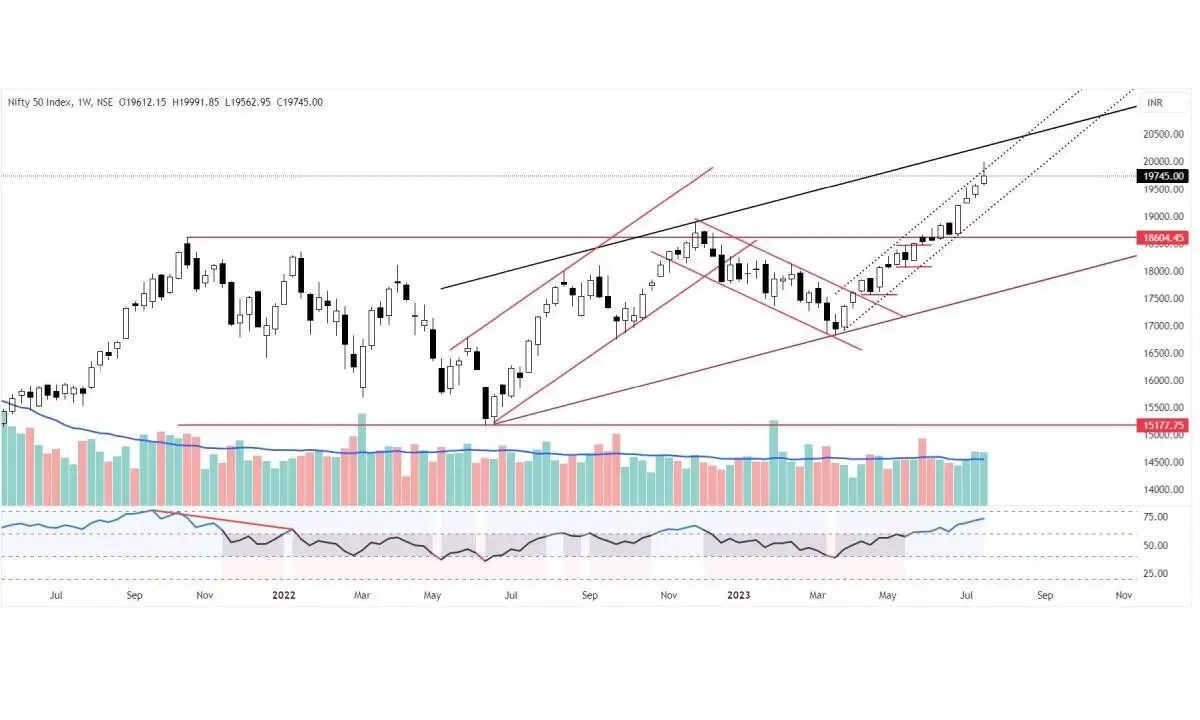
The benchmark index, the Nifty, continues to close above the prior week’s high for the fourth successive week. It formed two Shooting Star candles in alternate weeks, including the latest one. In the last eight days, the index has registered two distribution days. Even though there are no bearish signals available, the price pattern looks tired and exhausted. With Friday’s massive fall in volume, the momentum indicators declined from extreme levels or extreme overbought conditions. All the bearish patterns in recent history have failed, including a strong bearish grip. Unless the current bearish candle, Shooting Star, gets a confirmation, we cannot change the directional bias on the downside.
Six weeks ago, the Nifty broke out of an 85-week ascending triangle with a below-average volume. The ascending triangle breakouts normally lead to an impulsive move. Post breakout, the Nifty rallied by 7.5 per cent. The current upside move gained by 3,163 points or 18.80 in just 17 weeks. This is equaled to October 2021- June 2021 correction of 18.35 per cent. The current rally is more impulsive as it achieved it in just 50 per cent of the time of the major correction. The current rally is extended by just over 85 per cent of the prior upside swing. This is one of the most impulsive rallies in the history of Nifty. The pattern target, the 100 per cent extension, is placed at 20,525pts. Because of its impulsive nature, it distances too far from the mean average (20DMA). Whenever the Nifty moves more than five per cent away from the 20DMA, it tries to reverse to the mean level, which is at 19,372pts. Retesting of a pattern breakout is also a normal phenomenon. If the Nifty decisively closes well below the previous week’s low of 19,562pts, we test the 20DMA of 19,372pts. In case of retesting or pullback, the price retraces 38.2 per cent of the prior rally. In other words, Friday’s correction continues; it may test the 18,783pts, which is a meaningful correction. It may take 3-5 weeks to achieve this downside target.
In a bull case scenario, the pattern (Shooting Star) fails to get the confirmation for its implications; we will see the extension of the rally towards the 100 per cent target of 20,525 sooner. To achieve this, it must not close below the prior weekly low and must continue to move higher above the previous week’s high. We can’t project more than this for now on the upside. The risk-reward is 1:1 on both sides, as we are expecting the Nifty to move between the 18,783-20,525 range. This 1,742 points range is the highest probability for the Nifty, and we are exactly at the middle range.
On Friday, post-market, the index heavyweight Reliance announced disappointed earnings and the ADR price declined by almost six per cent. If the Reliance stock falls by six per cent on Monday, the Nifty may decline sharply. With a technical glitch, the MSCI India index declined by nine per cent on Friday. Importantly, the Dollar Index (DXY) rallied to 101.09. On the weekend, the Global indices closed flat to negative.
Last week, the India VIX rose by 7.51 per cent, but still, it is in the historically lower band. The Nifty Price-Earnings Ratio advanced to above 24 level, which is one year high. It is just below the two-year average. The Price to Book Value Ratio is at 12 year high of 4.8. These are other evidence of markets at over value zone. In harsh words, the market is fundamentally in a bubble territory.
In the current fundamentally over-valued and technically over-extended scenario, it is better to take out the profits on the table. We must be cautiously optimistic as long as it trades above the prior week’s low.
(The author is Chief Mentor, Indus School of Technical Analysis, Financial Journalist, Technical Analyst, Trainer and Family Fund Manager)

