Avoid taking long positions
ADX declines to below 14, an indication of weaker strength in the trend
image for illustrative purpose

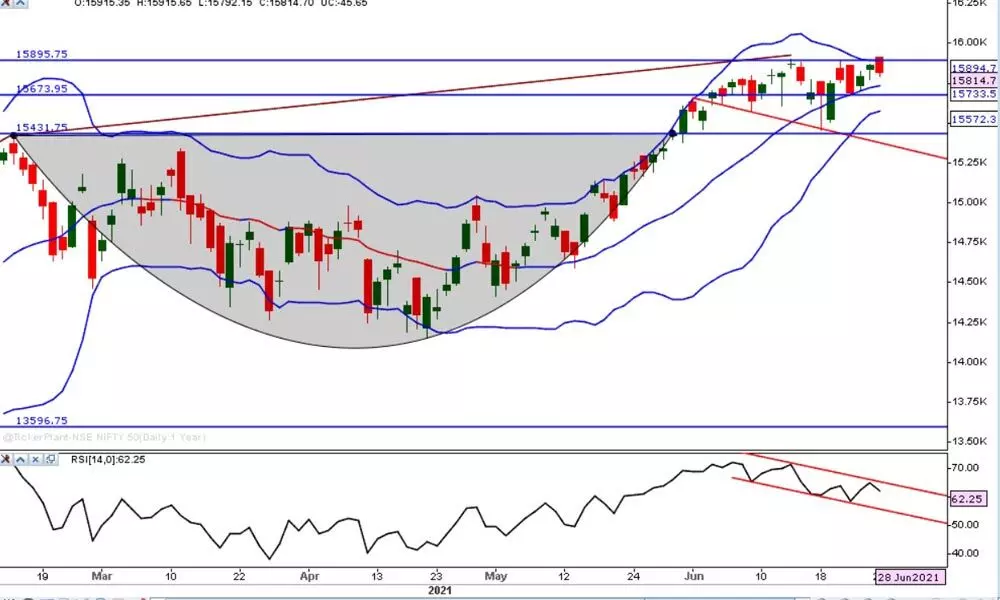
A close below 15,742 points also a third consecutive negative close after May 14. The RSI closed below the prior swing low, is indicating the weakness. It is also moving in a downward channel. The MACD histogram shows the increased bearish momentum
After opening in a flat to negative note, the NSE Nifty turned decisively negative. As the volume increased higher than the previous day, and the fall is over 0.25 per cent, it registered a distribution day. The Nifty finally settled at 15,748.45 level with a decline of 66.25 points. The FMCG and pharma indices up by 0.50 per cent and 0.58 per cent respectively. All the other sectoral indices were down on selling pressure. The Metal index down by 1.22 per cent, and the Bank Nifty and Auto indices declined by 0.90 per cent. The market breadth turned negative as 1,045 declines and 884 advances. About 174 stocks traded in the upper circuit, and 155 stocks hit the new 52-week high.
As the Nifty opened in a negative zone and closed below the previous day's low, our suspicion has become a reality. Monday's Bearish Engulfing got the confirmation. The index closed below the two-day low with a negative breadth looks like the bulls are losing control. It closed on the support of 20DMA for the day. A close below the 20DMA (15742) is a first confirmed sign of bearish implications. As the Bollinger Bands came very close, expect a volatility expansion soon. A close below 15,742 points also a third consecutive negative close after May 14. The RSI closed below the prior swing low, is indicating the weakness. It is also moving in a downward channel. The MACD histogram shows the increased bearish momentum. The negative directional indicator -DMI further raised, and the ADX declined to below 14, which is also an indication of weaker strength in the trend. The VIX declined another 2.98 per cent to 13.0025 is a very dangerous signal evolving in the market. Historical lower volatility may result in sharp price movements. On a 75- minute chart, the Nifty closed below the MA Ribbon along with the MACD line below the zero. This setup shows a short-term bearish price structure. For now, avoid taking the long positions unless the Nifty moves above the prior day high of 15,835 points.
(The author is financial journalist, technical analyst, family fund manager)

