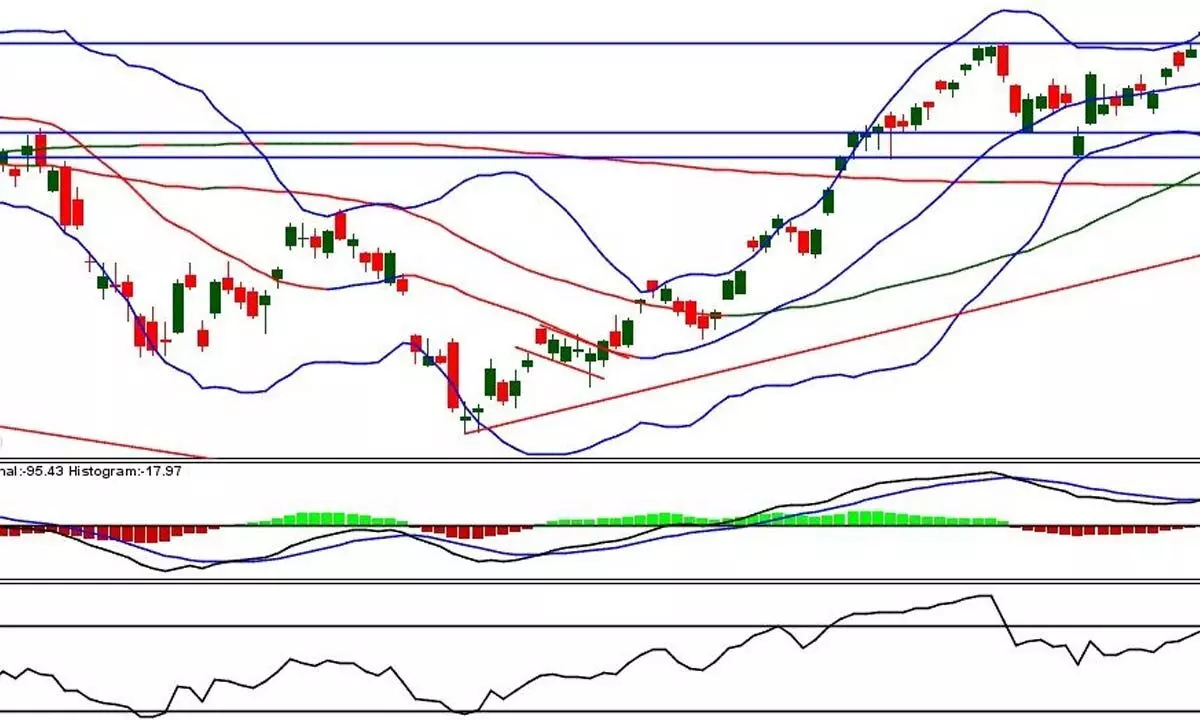
A decline below 16855 may confirm downside move
It almost tested rising trend line support drawn from 17th June low; Weekly MACD is also about to give a bearish signal; It makes lower high, lower low candle, but still an indecisive candle
image for illustrative purpose

The Macroeconomic data and the Federal Reserve comments dampened the sentiments in the equity markets. On a weekly expiry day, volatility has ruled the market. The frontline index, Nifty has declined by 109.25 points or 0.64 per cent and closed at 17014.35. Nifty Pharma, Metal and Media indices were able to close positively by a quarter a per cent. The Bank Nifty and Fin Nifty were the worst hit with 1.26 per cent and 1.22 per cent, respectively. The other sector indices declined by 0.3 per cent to less than a per cent. The market breadth is negative as 1320 declines and 536 advances. About 43 stocks hit a new 52-week low, and 54 stocks traded in the upper circuit. Wipro, HDFC Bank, and ICICI Bank were the top trading counters on Thursday.
The benchmark index is experiencing increased volatility, with a weaker global market influence. The Nifty has been traded within Tuesday's range for the last two days, though it declined over 100 points. For the third successive day, it tested the 200DMA and bounced sharply. It almost tested the rising trend line support drawn from the 17th June low.
At the same time, it broke the bearish flag support on an intraday basis. The fact is that the Nifty has made a lower high and lower low candle, but an indecisive candle again. The recovery in the afternoon session is because of the short-covering as the weekly expiry is on and the recovery in global futures. The Momentum has increased mostly on the downside. As mentioned earlier, the range hasn't been breached yet. It is trading between 20DMA and 200DMA. The 50DMA and the 200DMA have entered into a downtrend, which is significantly negative for the index. Importantly, the distance between 20 and 200DMAs is narrowed. Currently, the 20DMA is at 16274, which is a similar level to Tuesday's high. The Nifty sustained below the moving average ribbon on the hourly chart, and the MACD line is below the zero line. The Weekly MACD is also about to give a bearish signal. The weekly RSI is already declined below the 50 zone. The Nifty is forming a bearish bar on the weekly chart but within the previous week's range. A decline below 16855 will confirm the downside move.
(The author is Chief Mentor, Indus School of Technical Analysis, Financial Journalist, Technical Analyst, Trainer and Family Fund Manager)

