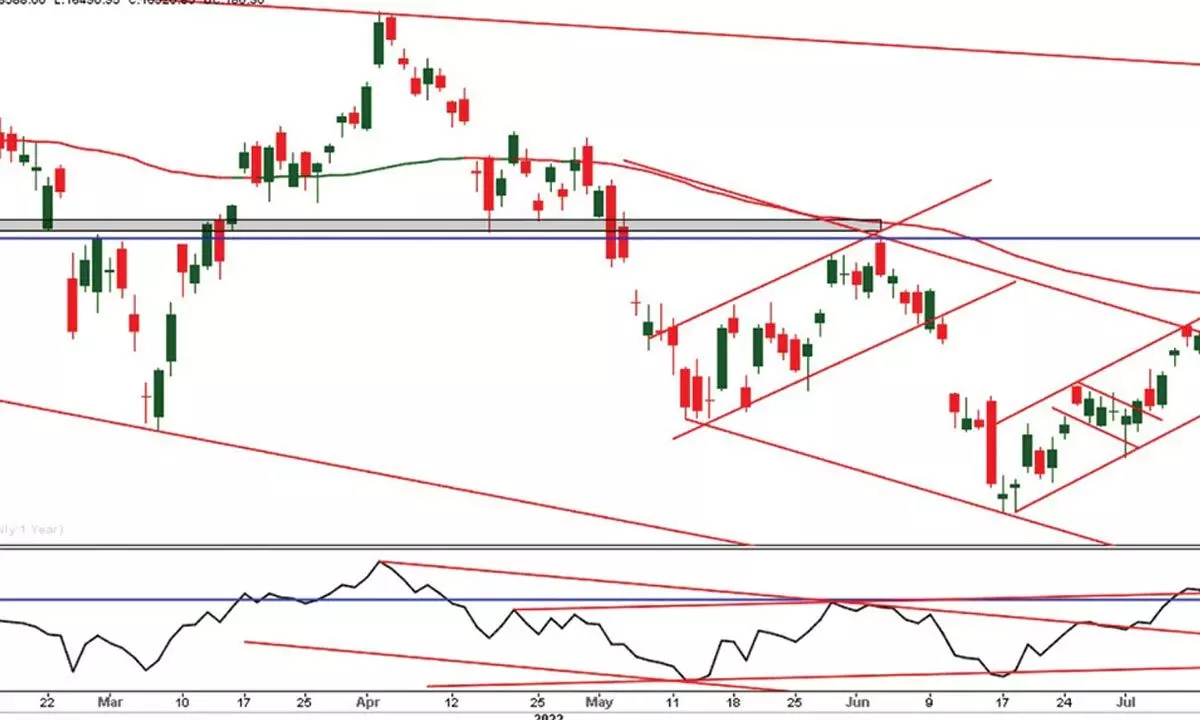
16437 may act as major support for uptrend
Nifty closed above the 20 weekly average and formed the strongest bullish candle
image for illustrative purpose

On Thursday, weekly expiry session, the domestic equity markets closed above the previous day's high. The Nifty closed above the psychological level at 16,605.25 points, a gain of 84.40 points or 0.51 per cent. Only the Pharma index was down by 0.47 per cent, and all the sector indices closed in the green. Interestingly, only a few of the sector indices gained over a per cent.
The top gainer is the media sector with 1.19 per cent followed by Metal index with 0.86 per cent and Infra index with 0.81 per cent. The Nifty Midcap-100 index is up by 1.38 per cent and the Smallcap-100 index gained by 0.77 per cent. The market breadth is positive, with 1167 gainers and 700 declines. About 43 stocks hit a new 52 week high, and 94 stocks traded in the upper circuit. IndusInd Bank, Reliance and Gland Pharma were the top trading counters on Thursday.
After 13 weeks, NSE Nifty closed above the 20 weekly average and formed the strongest bullish candle. The Weekly RSI broke the falling wedge, which is an indication of bullish strength. The Nifty gained over 645 points or 4.04 per cent during the last five days of trading. The Nifty faced resistance at the upward channel supply line. It opened with a huge positive gap on Wednesday and failed to sustain at higher levels. For the last two days, the index has been hovering around 16,600 and has formed an outside bar.
As it is still at the channel resistance line, it is better to wait for a breakout or a reversal. The current upswing is 24 sessions old and rallied 1424 points or 9.38 per cent. The previous longest swing was 27 days, which rallied 15.4 per cent during May. The 100 EMA into an uptrend, which is currently at 16437, will act as major support for now. The 100DMA which is also acting as support for the last two days, is at 16525, and is immediate support. Only below this level Nifty can change its direction towards the downside.
Importantly, the index closed above the Bollinger bands is an indication of an overextension of the trend. During the current major downtrend, the Nifty never extended beyond the Bollinger bands. This is giving confusing signals to the traders. One way is the strong close, and no indicator shows a negative bias. On the other side, the rally is extended and at the crucial resistance. So, it is better to have a light position or keep it sideways for some time.
(The author is Chief Mentor, Indus School of Technical Analysis, Financial Journalist, Technical Analyst, Trainer and Family Fund Manager)

