Charts hint further correction
For the short term traders now 59,400 would be the key resistance zone, below which it could slip till 58,500-58,200; on the flip side, a fresh uptrend possible only after 59,400 level
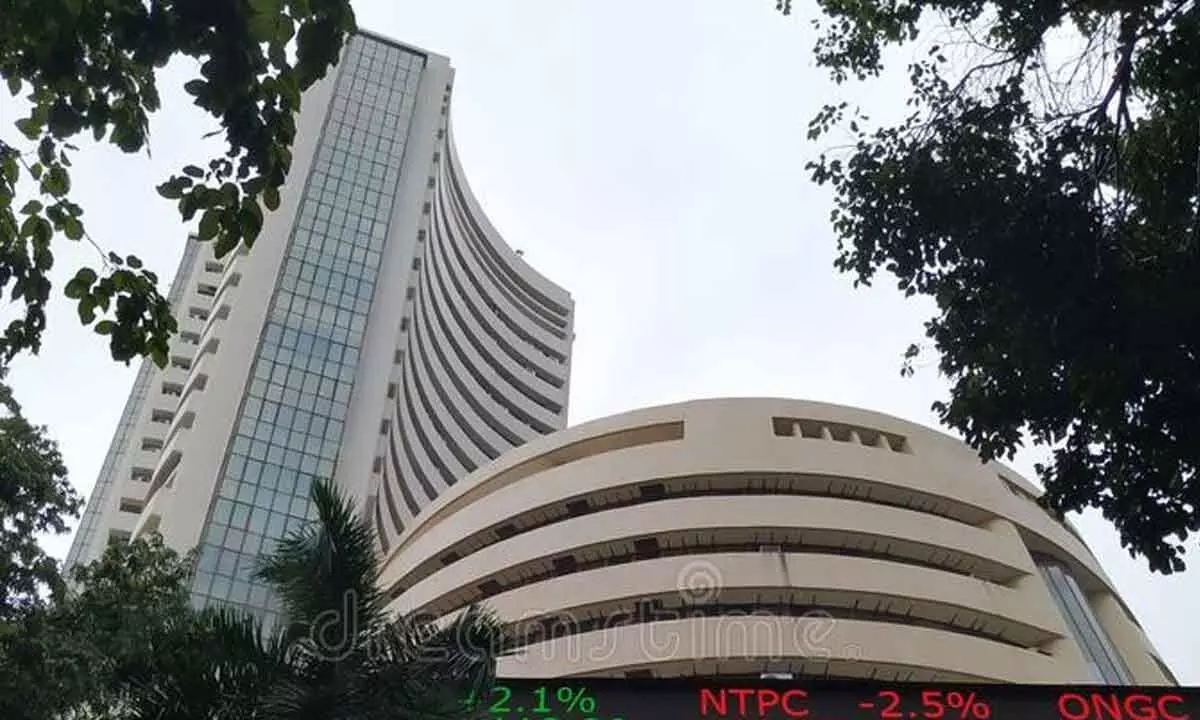
image for illustrative purpose

Mumbai: The market witnessed volatile session on Thursday on account of F&O expiry. BSE Sensex was down by 310 points. Among sectors, despite weak market momentum PSU banks outperformed as a result, PSU Bank index rallied over 2.5 per cent, whereas profit booking continued in IT and Metal stocks.
Technically, lower top formation on intraday charts and bearish trend reversal candle on daily charts indicating further correction from the current levels.
"We are of the view that, the index has completed one leg of pullback rally and reversed. For the short-term traders now 59,400 would be the key resistance zone," says Shrikant Chouhan, Head of Equity Research (Retail), Kotak Securities.
Below which, the Sensex could slip till 58,500-58,200. On the flip side, a fresh uptrend possible only after 59,400 level. Above the same, the index would move up to 59,700-59,900.

