Rural vs. Urban Divide: Consumption patterns across India's states
The information in the survey was collected from 8,723 villages, and 6117 urban blocks over the entire country covering 2,61,746 households
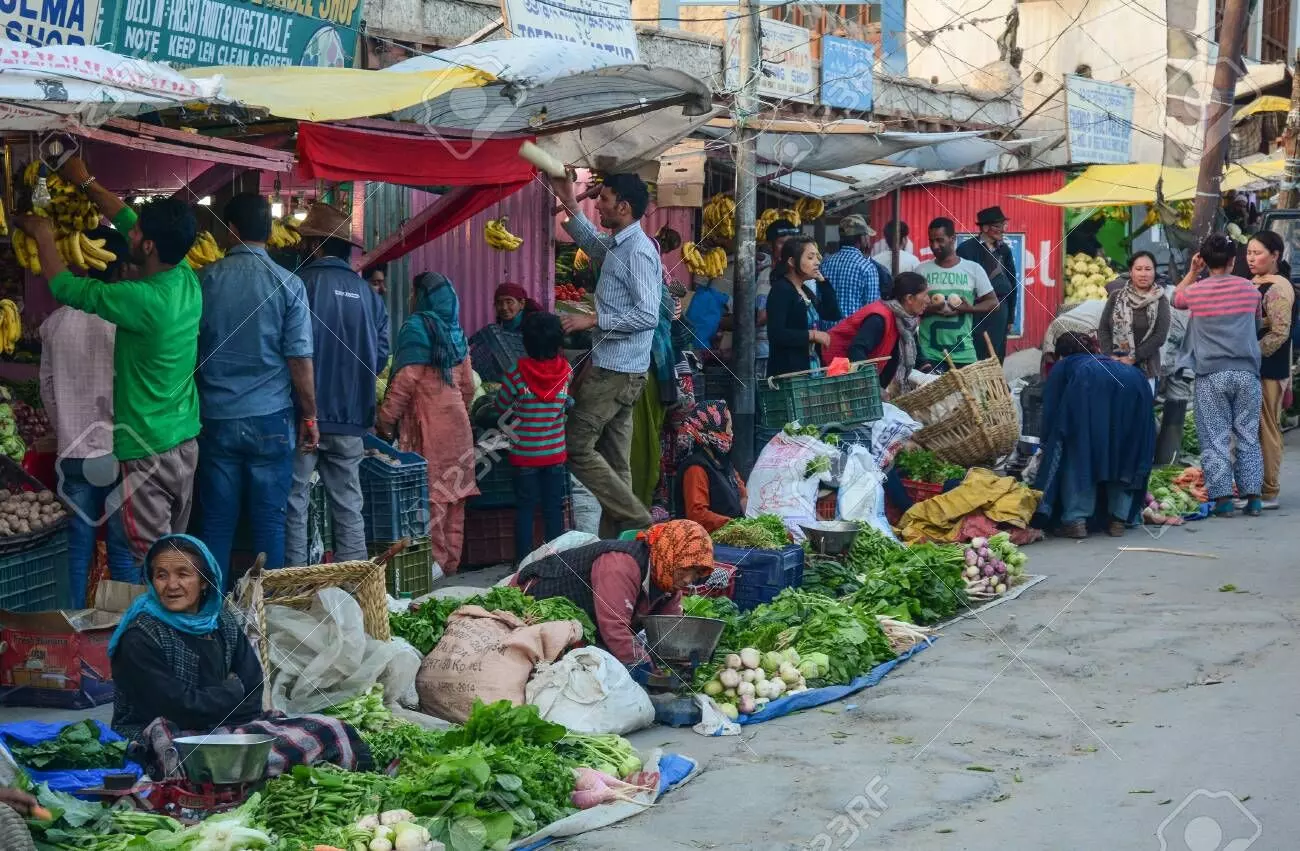
image for illustrative purpose

Hyderabad: The central government recently released the consumption/consumer expenditure survey report after more than a decade. Conducted by the National Sample Survey Office (NSSO), the 68th survey, the last one being in 2011-12, covers the 2022-23 period titled “Household Consumption Expenditure Survey”.
This comprehensive survey spanned the entire country, excluding a few inaccessible villages in the Andaman and Nicobar Islands. Data was collected from 8,723 villages and 6,117 urban blocks, covering 2,61,746 households (1,55,014 in rural and 1,06,732 in urban areas). The consumption basket was divided into three broad categories: food items, consumables, services, and durable goods.
Three separate questionnaires for each category were designed and administered in selected households over three separate monthly visits per quarter. Additionally, another questionnaire collected information on household characteristics and demographic details. Various sequencing of the questionnaires was used to avoid bias.
In 2022-23, the average Monthly Per Capita Consumption Expenditure (MPCE) was Rs. 3,773 in rural India and Rs. 6,459 in urban India. Food accounted for 46 percent and 39 percent respectively, while non-food items accounted for 54 percent and 61 percent in rural and urban India. Notably, the 5 percent of the population at the bottom and top had an average MPCE of Rs. 1,373 and Rs. 10,501 respectively in rural India, and Rs. 2,001 and Rs. 20,834 in urban India.
Among states, Sikkim had the highest MPCE in both rural and urban areas at Rs. 7,731 and Rs. 12,105 respectively, while Chhattisgarh had the lowest at Rs. 2,466 and Rs. 4,483. The rural-urban difference in average MPCE was highest in Meghalaya at 83 percent, followed closely by Chhattisgarh at 82 percent. Among Union Territories, Chandigarh had the highest MPCE (rural-Rs. 7,467 & urban-Rs. 12,575) and Ladakh had the lowest (Rs. 4,035).
Over the last two decades, the difference as a percentage of rural MPCE (for urban) narrowed to 71.2 percent from a high of 90.8 percent in 2004-05. The share of food in MPCE decreased from 59.4 percent for rural in 1999-00 to 46.38 percent in 22-23, and from 48.06 percent to 39.17 percent for urban. The percentage share of cereals in average MPCE also decreased (for rural from 22.23 to 4.91 and 12.39 to 3.64 in urban).
Within food items, there was a stark difference in percentile breakup of MPCE between rural and urban areas, such as egg, fish & meat at 4.91 and 3.57 respectively. In the non-food items category, pan, tobacco & intoxicants stood at 3.79 and 2.43, and medical at 7.13 and 5.91 respectively for rural and urban. The highest difference in percentage composition of MPCE for food items was seen in beverages and processed food at 9.62 for rural India, followed by milk and milk products at 8.33. In the non-food category, the highest differences were observed in conveyance at 7.55 percent, durables at 6.89 percent, and fuel & light at 6.66 percent, reflecting a growing consumption trend.
Similar trends were observed in urban areas, with beverages and processed food at 10.64%, and milk and milk products at 7.22%. In the non-food category, conveyance was at 8.59 percent, followed by durable goods at 7.17 percent and fuel and light at 6.26 percent. Rent occupied 6.26 percent of urban consumers versus a mere 0.78 percent in rural areas.
On average, the MPCE for self-employed households in agriculture was Rs. 3,702, while in non-agriculture it was Rs. 4,074, compared to Rs. 6,067 in urban areas. Rural casual non-agricultural labor had an average MPCE of Rs. 3,315 versus Rs. 4,379 in urban areas, while regular wage/salaried earnings in non-agriculture in rural areas were at Rs. 4,533 versus Rs. 7,146 in urban areas.

